
Introduction
Private equity isn’t just about piling on debt and flipping companies for a quick profit. The old stereotype of PE success being driven solely by high leverage is increasingly outdated. While financial engineering (debt and clever financing) played a huge role in the LBO boom of the 1980s, today’s top investors know that creating real value requires more than just leverage.
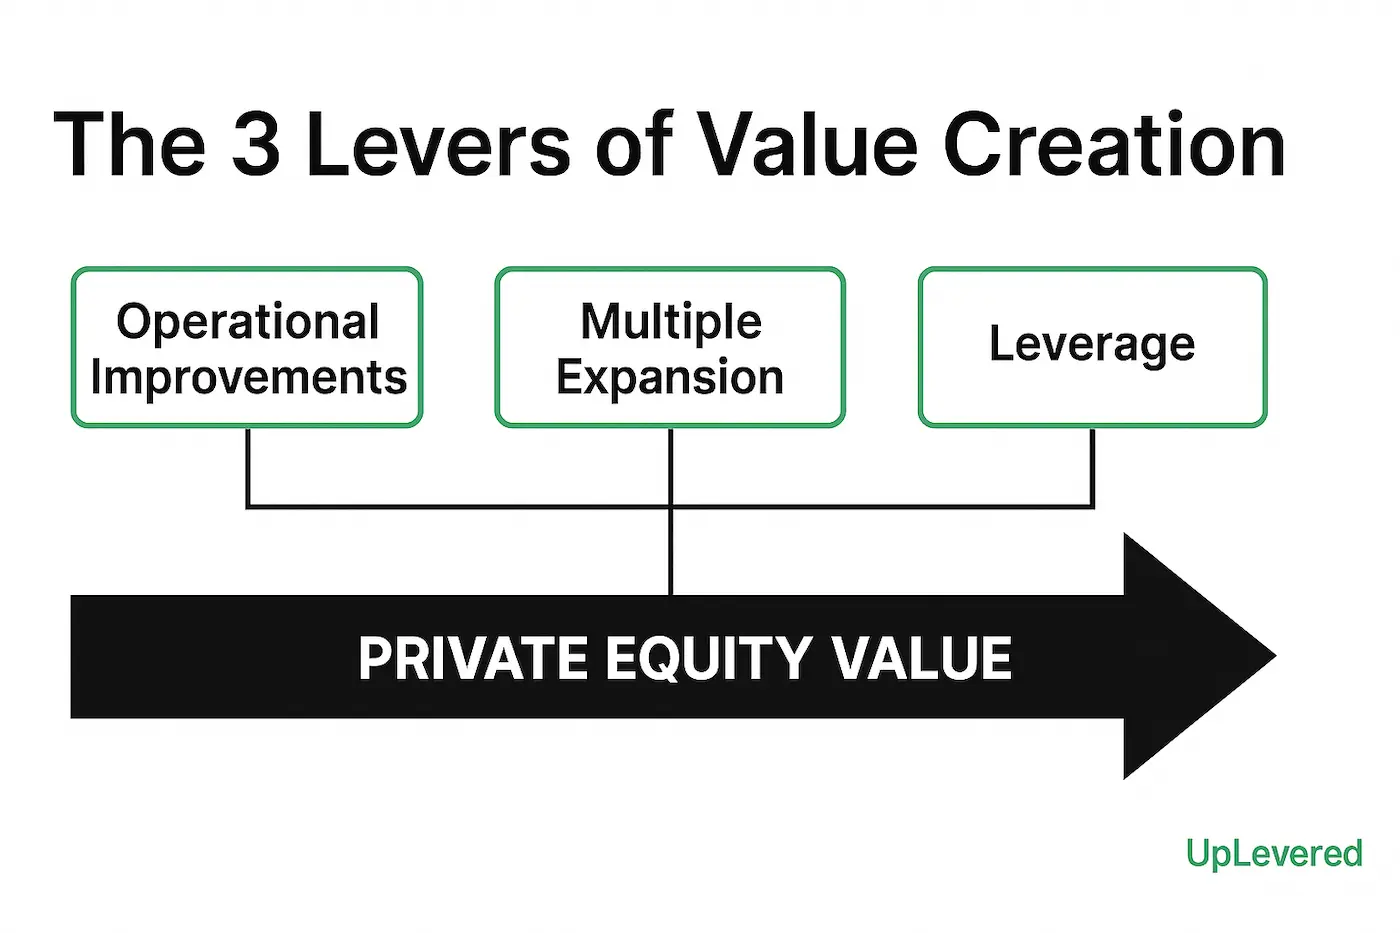
The five practical levers in this guide—revenue growth, margin expansion, multiple movement, net-debt reduction, and add-on acquisitions—organize into three terminal bridge buckets: operating performance, multiple movement, and net-debt change. Add-ons can affect all three. Gompers and Kaplan, studying what private equity firms actually do, sort the work into financial, governance, and operational engineering; the bridge buckets here show how selected effects appear in terminal equity value. This practical guide explains the mechanics without treating one bridge as a universal return split.
We’ll break down the classic formula of how PE firms turn an initial equity investment into a profitable exit. Then, we’ll deep dive into the two categories of value levers – financial engineering (deleveraging and multiple arbitrage) and operational improvements (EBITDA growth) – with examples and strategies. By the end, you’ll understand how improvements in earnings, changes in market valuation, and prudent debt management all factor into private equity success. Let’s start with a quick overview of the PE value creation formula.
TL;DR - Attributing Value Creation in PE
A simplified terminal equity-value bridge decomposes the change between entry and exit into three buckets:
- Revenue growth + margin expansion → EBITDA growth (operational)
- Multiple expansion → higher exit EV/EBITDA than entry (market/strategic)
- Net-debt reduction → debt paydown and cash build increase terminal equity value (financial engineering)
Use this framework to explain a terminal equity-value change, while showing interim distributions, follow-on equity, fees, FX and timing separately. The bucket split depends on bridge order; it is not a universal additive IRR identity.
The “How PE Makes Money” Formula: A Quick Overview
Entry Equity Value → (EBITDA growth at entry multiple + multiple movement on exit EBITDA + net-debt reduction) → Exit Equity Value
This entry-first terminal equity-value bridge is one useful convention. It assigns the EBITDA/multiple interaction to the multiple bucket and excludes interim cash flows unless they are added separately:
- EBITDA Growth – Grow revenue (new markets, pricing hacks) or slash costs (supply chain / vendor tweaks); larger profit $’s jack up enterprise value by a multiple ($1 x 8.0x) and your equity slice.
- Multiple Expansion – Sell at a higher EV/EBITDA than you bought (e.g., 6× in, 8× out).
- Net-Debt Reduction – Show principal repayment and cash accumulation separately; with the other bridge inputs held constant, a $1 reduction in terminal net debt adds $1 to terminal equity value.
The interactive exhibit uses a synthetic clean-equity case that bridges $75M to $248M. It is separate from the linked sponsor case’s $80M check, fees, minimum cash and roughly $245M of proceeds. Use the bridge to pressure-test terminal value mechanics, not as evidence of a typical return split.
For the primary-source method review behind that boundary, see Evidence Atlas EA-01. The reviewed studies do not support one portable value-creation ranking or fixed IRR-contribution range.
Value Creation Analysis Traps
1. Confusing Revenue Growth with Margin Improvement
Revenue can grow while margins shrink (pricing pressure, input cost inflation, sales mix shift). Always decompose EBITDA growth into revenue × margin components separately.
2. Ignoring Working Capital in FCF
EBITDA growth can fail to convert into cash when working capital absorbs the incremental margin. Revenue growth and NWC intensity alone do not prove that result; show gross margin, EBITDA margin, capex, taxes, collection timing and the definition of NWC intensity in the FCF bridge.
3. Exit Multiple Expansion as Base Case
UpLevered’s conservative house convention starts with exit multiple equal to entry multiple. Any expansion should be justified with explicit business-quality or market assumptions, and the downside case should include compression. This is an underwriting policy, not an empirical prediction.
4. Over-Leveraging to Inflate Equity Returns
Higher leverage can amplify equity returns and losses while reducing financial flexibility. There is no universal leverage breakpoint across sectors, dates and structures; show returns, cash interest coverage and covenant headroom across multiple leverage scenarios using dated market inputs.
Before presenting any returns attribution or IC memo:
Value Creation Bridge Checklist
- Bridge ties: entry equity + EBITDA growth contribution + multiple expansion contribution + deleveraging contribution = exit equity
- EBITDA growth decomposed: revenue growth × margin expansion (not just total EBITDA change)
- Multiple expansion justified with specific operational improvements, not assumed
- Net-debt change sourced: separate mandatory amortization, cash sweep, new borrowing, distributions and cash build
- House base case conservative: exit multiple ≤ entry multiple unless justified
- House sensitivity ranges disclosed rather than presented as market standards
- 100-day plan mapped to specific lever (which initiatives drive which lever?)
Due Diligence: The Launch Pad for Any Lever
Before a deal closes, PE teams dissect financials, operating KPIs, and talent depth. Diligence should test which initiatives are feasible, what evidence could disprove them, and how costs, timing and risk change the modeled outcome. Mapping findings to a 100-day plan turns a hypothesis into an accountable workstream; it does not guarantee IRR.
Deep Dive: The Financial Engineering Levers
Private Equity Value Creation Lever #1: Deleveraging (Debt Paydown)
Using debt effectively (and then paying it down) is the original magic of leveraged buyouts. In a typical LBO, the private equity firm finances a large portion of the acquisition with borrowed money (debt). This amplifies returns on the way in – less equity up front – but the real trick is what happens during the holding period: the company’s cash flows are used to pay off that debt gradually, converting debt into equity. This is known as deleveraging.
Optimizing Capital Structure
The right debt-to-equity mix is deal- and date-specific. Senior debt can reduce the equity check but adds fixed claims; junior capital can extend flexibility but raises cost. Use current lender evidence for leverage, pricing and covenant assumptions. Repricing or repayment can improve equity outcomes, but the magnitude must be calculated from the actual debt schedule rather than a portable IRR range.
Think of it this way: if enterprise value (EV), share count, distributions and new equity remain unchanged, every dollar of terminal net-debt reduction adds one dollar to terminal equity value. Repayment does not itself create enterprise value. Here’s a synthetic example:
-
At Entry: Buy a business worth $100 million at a 50/50 debt-to-equity split. So $50m debt, $50m equity (your investment).
-
During Hold: Over several years, the company generates cash and uses $30m of it to repay debt. Debt is now only $20m.
-
At Exit: Even if the enterprise value is still $100m, equity value = $100m – $20m debt = $80m. Your equity stake went from $50m to $80m just by paying down debt. That’s a 1.6× multiple without any improvement in the company’s operations.
Historical accounts of 1980s LBOs emphasize leverage and debt repayment, but the exact contribution depends on the sample, bridge definition and return basis. In the simplified terminal example above, deleveraging increases equity value even if enterprise value does not change. Real deals also include interest, taxes, fees, distributions, refinancing and timing.
However, there are limits to this lever. First, the company needs robust and stable cash flows to service debt and avoid default – not every business can support a large debt load. Second, using high leverage increases risk: a downturn can jeopardize the company if it can’t meet interest payments. And third, there’s a finite amount of debt that can be repaid (once it’s zero, that lever is maxed out).
Synthetic Numeric Example: Suppose a PE firm buys a company at 5× EBITDA for $200m EV (with $150m debt financing and $50m equity). If over five years EBITDA and EV remain flat and terminal debt falls to $50m, exit equity value is $150m, or 3.0× the entry equity. That arithmetic assumes no fees, taxes, distributions, new equity or other interim cash flows.
In short, using leverage doesn’t create new enterprise value, but paying down debt shifts more of the pie to equity. It’s a tried-and-true way PE firms juice returns, especially when combined with the next of the private equity value creation levers: selling the company for a higher multiple.
Private Equity Value Creation Lever #2: Multiple Expansion
Multiple expansion (a.k.a. multiple arbitrage) means “buy low, sell high” – not in terms of price, but in the valuation multiple. In private equity, the valuation metric usually referenced is EV/EBITDA. For example, if you purchase a business at 6× EBITDA and later exit at 8× EBITDA, you’ve achieved multiple expansion. Even if the company’s earnings were unchanged, a higher EV/EBITDA multiple at sale means a higher enterprise value and thus a higher equity value.
Multiple expansion can occur due to external market factors or strategic improvements in the company (or both). Here are a few ways PE firms try to boost the exit multiple:
- Market Timing & Cycles: Multiples can expand or compress as financing conditions, growth expectations and buyer competition change. Underwrite that exposure with dated market evidence and a compression case rather than assuming the next exit environment.
- Size and Scale (“Platform” Multiple Arbitrage): Add-on acquisitions can change scale, growth, customer concentration and buyer relevance. A simplified 5× tuck-in / 7× platform example illustrates the hypothesis, but integration costs, synergies, quality differences and the buyer’s treatment of acquired EBITDA determine whether any uplift is realized.
- Strategic Repositioning: A sponsor may change business mix or risk characteristics in ways that affect the exit multiple. Treat an 8×-to-15× repositioning story as a hypothetical sensitivity unless the exact transaction, integration work and realized exit evidence are identified.
- Improved Business Quality: Multiple isn’t only about industry or size – it also reflects perceived quality and risk. If during PE ownership the company diversifies its customer base, installs a top-notch management team, or achieves more predictable recurring revenue, buyers may be willing to pay more for those improved fundamentals. For example, converting one-time product sales into a subscription model could elevate the exit multiple because recurring revenue streams are valued higher. Reducing risk (deleveraging helps here too) and improving growth prospects can lead to multiple uplift by way of a better company profile.
It’s important to note that multiple expansion often lies partly outside management’s control. You can dress up a company to justify a higher multiple, but broad market sentiment plays a big role. When credit is cheap and stock markets are up, multiples expand; when interest rates and uncertainty rise, multiples tend to shrink.
Because entry and exit markets change, multiple expansion should not be treated as a repeatable operating capability. UpLevered’s house base case starts at a flat multiple and tests both expansion and compression; current underwriting norms require a separate dated market review.
In summary, multiple expansion is a powerful but unpredictable lever – a bit of a momentum play. It’s great when you can get it, but as a PE investor you don’t want your thesis to rely on selling into a hot market. “Buy low, sell high” works best when you actively make the company more valuable to the next buyer, not just hope for a market bump.
Deep Dive: The Operational Value Lever
Private Equity Value Creation Lever #3: Driving EBITDA Growth
Operating performance is the most directly controllable terminal-value bucket, but it is not universally the largest return driver. Revenue growth, margin change and cash conversion should be modeled separately because their economics and execution risks differ.
The evidence does not support one stable contribution ranking. Guo, Hotchkiss and Song find operating gains, industry-multiple changes and leverage tax benefits all economically important in older large US take-privates. Biesinger, Bircan and Ljungqvist find that successful execution—not one ex-ante strategy—predicts gross outcomes in a mixed emerging-market sample. Those studies answer different questions and should not be averaged.
Füss and coauthors report that entry pricing changes both performance and the apparent EBITDA-versus-multiple mix, but their accessible metadata covers entry vintages only through 2018 and leaves key method fields unresolved. A Swedish firm-outcomes study by Kärnä and Samantha Myers finds higher debt without an average productivity gain; it qualifies universal operating-improvement language but does not measure sponsor returns. The practical answer is to underwrite the deal in front of you.
Revenue Growth Strategies
Top-line growth can increase EBITDA when unit economics and cash conversion hold. Test price, volume, churn, variable cost and reinvestment rather than assuming revenue growth is automatically valuable. Candidate strategies include:
Leveraging market insights through research and data analysis helps inform these strategies, supporting better valuation, competitive positioning, and identification of growth opportunities.
- Price Optimization: Test willingness to pay, discount leakage and packaging. A 5% list-price increase does not flow one-for-one to EBITDA if volume, churn, mix, commissions or service cost change; model the realized price and retention response.
- Geographic Expansion: Entering new regions or markets to access more customers. A company might be dominant domestically, so a PE firm helps it expand to Europe or Asia, instantly enlarging the addressable market. Geographic expansion can involve opening new sales offices, targeting international client segments, or acquiring a local player in a new region. For instance, a PE-backed consumer brand might launch in Latin America or a SaaS company might start selling in Europe – driving additional sales beyond the home market. Expanding market reach is a tried-and-true way to accelerate growth.
- Upselling and Cross-Selling: Deepening customer relationships to sell more products/services per client. PE firms often implement programs to better leverage the company’s customer base – for example, training the sales team to upsell premium products or cross-sell complementary offerings. By bundling products or offering integrated solutions, companies can increase revenue per customer. Think of a PE-owned industrial manufacturer that starts cross-selling maintenance services to equipment buyers, or a software company that upsells existing clients to a higher-tier subscription. These strategies boost revenue with relatively low customer acquisition cost since you’re selling more to folks you already serve.
- Product Innovation and Expansion: Investing in R&D or product development may open new revenue streams, but the case should include adoption, cannibalization, launch cost and time to scale. Tie product work to measurable customer evidence and economics rather than assuming innovation creates growth.
- Sales Force Effectiveness: Often overlooked, simply making the sales engine more effective can drive substantial growth. This includes hiring additional sales reps, providing better incentives or training, improving lead generation processes, and using data/CRM tools to boost conversion rates. PE firms frequently implement rigorous sales KPIs and analytics in portfolio companies. The idea is to squeeze more revenue out of the existing pipeline by improving sales productivity. Better territory planning, refined sales pitches, and focus on high-margin customers all fall here. A more effective sales force can increase revenue growth rate without any product change – by closing more deals or bigger deals than before.
Real-world tip: In sectors like software, PE investors (notably firms like Thoma Bravo) have excelled at rapidly professionalizing the go-to-market strategy – e.g., introducing disciplined pricing and sales processes – to unlock revenue growth in founder-led companies. In industrial or consumer businesses, sponsors might expand distribution channels (new e-commerce strategy, retail partnerships) to drive sales. The specific tactics vary by sector, but the overarching theme is grow the top line in a sustainable, often systematic way.
Margin Improvement Strategies
Equally important to growing revenue is improving profit margins – i.e. making the company more efficient so that a greater percentage of revenue converts into EBITDA. Margin improvement directly boosts EBITDA even if sales don’t budge. Key margin-focused levers include:
-
Cost Takeout: Cost actions can include facility consolidation, process redesign, procurement and organization changes. A dollar of gross savings adds a dollar to EBITDA only before implementation cost, stranded cost, reinvestment, service impact and revenue leakage. Underwrite net recurring savings and the time needed to realize them.
-
Operational Automation: Investing in technology and automation to streamline manual processes. This could involve implementing an ERP system, using robotic process automation (RPA) in back-office tasks, or automating parts of the production line. Automation can reduce labor costs, improve accuracy, and increase throughput. PE owners often fund these upgrades early in the hold period, yielding savings later. For instance, automating an assembly line might reduce labor needs and improve consistency, boosting gross margin. Similarly, automating routine accounting or customer service tasks (via software or AI bots) can reduce SG&A expenses. Embracing productivity tools and digital transformation is a key value lever in modern PE.
-
Procurement & Supply Chain Savings: Optimizing procurement can significantly lower COGS (Cost of Goods Sold) and other expenses. Tactics include consolidating suppliers to get bulk discounts, renegotiating vendor contracts, sourcing from lower-cost countries, or even hedging commodity prices to manage input costs. PE firms often bring in procurement experts to find quick wins – for example, leveraging the combined volume of several portfolio companies to negotiate better rates (if they buy similar materials). Improving supply chain efficiency (better logistics, reducing expedited shipping, optimizing inventory levels) also protects margins. A classic move is a zero-based budgeting approach to expenses: justify every expense from scratch to identify savings. Especially in times of inflation, getting a grip on spending and supplier costs is crucial for value creation.
-
SG&A Optimization: Benchmarking can identify a question, not prove removable cost. A company at 20% SG&A versus peers at 15% may differ in growth investment, business model or accounting classification. Normalize those differences and trace roles, systems and service levels before assigning savings.
-
Capex and Working Capital Management: Although not captured in EBITDA, controlling capital expenditures and optimizing working capital can improve free cash flow, enabling more debt paydown (indirectly boosting equity value). For completeness: PE firms ensure maintenance capex is spent wisely (no gold-plating) and projects have solid ROI. They also push portfolio companies to tighten working capital – e.g., improve collections, manage inventory – to generate cash. This doesn’t increase EBITDA, but it supports the lever of debt paydown (cash saved can reduce debt faster).
Data Analytics: 3 Testable Workstreams:
- Dynamic Pricing Pilot: Predefine the customer cohort, realized price, churn, volume and gross-margin test before rollout.
- Working-Capital Radar: Measure whether DSO or inventory improvements release sustainable cash or merely shift timing into the next period.
- Supplier Re-bid: Compare realized net savings after quality, service levels, switching cost and volume commitments.
These are diligence and execution templates, not observed UpLevered case results.
The best outcomes usually come from a combination of revenue growth and margin improvement. For instance, a PE firm might help a company grow revenue 30% and expand EBITDA margins from 20% to 25%. The compounding effect on EBITDA is powerful (in that example, roughly 62.5% increase in EBITDA).
It’s worth noting that which levers matter more can depend on the situation and sector. In a high-growth tech company, revenue growth may be the primary story (even if margins are temporarily low). In a mature manufacturing business, cost and margin improvements might be the bigger focus. Many industrial buyouts lean heavily on cost reduction early on, whereas software buyouts might prioritize sales expansion or pricing upgrades. Sector-specific behaviors: Firms like Thoma Bravo (tech-focused) are known for aggressive cost discipline and rapid revenue add-ons in software, while an industrial-focused fund might emphasize lean manufacturing and global expansion. Good PE investors tailor the playbook to the company’s reality.
To summarize, operating initiatives can drive EBITDA through revenue, margin and mix, but execution costs and cash conversion determine how much reaches equity value. The evidence does not support carrying one operational contribution percentage across deals. Model the specific initiative, counterfactual and bridge convention instead.
Edit the bridge below to test a terminal equity-value decomposition. It defaults to a synthetic clean-equity presentation based on assumptions from our distribution LBO case study, but it is not the sponsor cash-flow return.
Entry equity to exit equity, split into operating performance, multiple movement, and net-debt change. Select how the EBITDA/multiple interaction is allocated, then edit any input.
Entry-first (interaction assigned to multiple movement). Clean equity-value basis (enterprise value minus net debt). Bridge foots at the displayed precision: entry equity $75M + operating performance +$78M + multiple movement +$0M + net-debt change +$95M = exit equity $248M. House case: zero multiple expansion by design. The published case study reports 3.1x / 25.1% on the sponsor's $80M check (which also funds $5M fees and $5M minimum cash at close); this clean bridge shows 3.3x / 27.0%.
Need a dated cash-flow return rather than a terminal equity-value bridge? Use the Private Equity Returns Lab to choose the right calculator or method-controlled workbench.
Putting It All Together: Terminal Equity-Value Attribution
How do these private equity value creation levers translate into actual investment results? Deal teams use value-creation bridges to explain how terminal equity value changed. A separate cash-flow analysis is required for IRR because contribution basis points depend on timing, counterfactual order and interim cash flows.
This is often visualized in a “value creation bridge” or waterfall chart in deal reports. Start at entry equity value, add the operating-performance bucket, the multiple-movement bucket and net-debt reduction/cash build, and arrive at exit equity value. The bridge makes the underwriting comparison visible, provided its order and exclusions are disclosed.
In practice, here’s how you calculate each component:
- EBITDA Growth contribution: Take the change in EBITDA from entry to exit, and multiply it by the entry valuation multiple. This shows how much higher the enterprise value became thanks to higher earnings, holding the multiple constant. It answers “how much value came from improving operating performance?”
- Multiple Expansion contribution: Take the change in the EV/EBITDA multiple from entry to exit, and multiply it by the exit EBITDA. This isolates the effect of the market/investor sentiment – what value was gained (or lost) purely from the change in what buyers are willing to pay per dollar of earnings.
- Net-Debt Reduction contribution: Take entry net debt minus exit net debt, with new equity and distributions handled separately. Because net debt includes cash, this bucket can reflect both principal repayment and cash accumulation.
These buckets reconcile to the terminal change in equity value under this entry-first order. They can be expressed as percentages of terminal value creation, but they do not convert uniquely into additive IRR basis points.
Why does this matter? Because it holds the deal team accountable to the original plan and makes the method inspectable. On the synthetic clean basis, $75M of entry equity plus $78M of EBITDA growth, $0 of multiple movement and $95M of net-debt reduction/cash build reaches $248M of exit equity: 3.31× and about 27.0% over five years. Separately, the sponsor case uses an $80M check, including $5M of fees and $5M of minimum cash, and roughly $245M of proceeds to report about 3.1× / 25.1%. Do not combine the clean exit value with the sponsor return.
If a deal’s return relies heavily on one bucket, treat that as a prompt for additional diligence rather than a universal pass/fail rule. Multiple-driven returns need a compression case; net-debt-driven returns need a cash-conversion and downside test; EBITDA-driven returns need evidence that growth and margin changes are durable and causally linked to the plan. There is no universal ideal mix.
In portfolio reviews, firms use these analyses to steer resources too. If halfway through the hold period it’s clear that, say, revenue growth is lagging but the market multiple has expanded, they know the value creation gap is in operations and will double down there. Monitoring portfolio performance is especially important during periods of economic downturns and market volatility, as these factors can impact investment returns. Conversely, if performance is great but market conditions have deteriorated (multiple compression), they might strategize on timing exits or additional operational improvements to compensate.
Another real-world use is in GP marketing to LPs: firms showcase past-deal bridges to explain their value-creation approach. Treat those charts as manager-reported marketing evidence. Compare bridge order, gross/net basis, acquisitions, interim cash flows and realized exits before treating two managers’ percentages as comparable.
To sum up, a value bridge explains terminal equity-value change; a dated cash-flow schedule explains IRR. Informed decision making requires both, with the bridge order, return basis and exclusions disclosed. Modern PE professionals should model the drivers, execute the plan and explain where the result differs from the underwritten counterfactual.
(If you’re building LBO models yourself, include a returns-attribution tab. It forces you to identify which assumptions drive the model. A case dominated by assumed multiple expansion or aggressive leverage deserves a specific downside test, not an arbitrary universal cutoff. For more on common modeling pitfalls, see our guide on LBO modeling traps to avoid.)
Conclusion
Operating performance, multiple movement and net-debt change are useful terminal bridge buckets, not a universal ranking of what “really” creates value. Revenue growth, margin expansion and add-ons can move more than one bucket, while financing, market conditions and timing affect the equity outcome. The best underwriting makes each assumption explicit and tests what could break it.
For anyone looking to break into private equity (or advance in it), it’s critical to internalize these concepts. Think like an investor: when evaluating a company, ask how you could increase its EBITDA, whether the market might value it more highly in the future, and how you’d manage its capital structure. In diligence and in modeling, break down the sources of value – don’t just project a high IRR, explain what’s driving it. This mindset will not only help you impress in interviews and memos, but also steer you toward better decisions in managing real investments. (We emphasize this “investor mindset” in our Private Equity Resume Template guide – showing you understand value creation levers can set you apart.)
In the end, use debt, valuation and operating assumptions deliberately, but do not force every deal into the same contribution mix. Show the dated cash flows, reconcile the terminal bridge, label synthetic examples and separate controllable execution from market exposure.
Frequently Asked Questions (FAQ) on Private Equity Value Creation Levers
What is multiple expansion in private equity?
Selling a company at a higher EV/EBITDA or EV/Revenue multiple than you paid. The return effect depends on entry equity, EBITDA, net debt, hold period and interim cash flows, so there is no portable basis-point range.
How does deleveraging increase equity returns?
With enterprise value, share count, distributions and new equity held constant, a dollar of net-debt reduction increases terminal equity value by a dollar. The IRR effect depends on the deal’s starting equity, timing and cash flows.
Which private-equity value-creation lever has the greatest impact on returns?
There is no stable universal ranking. Operating performance, multiple movement and net-debt reduction can each matter materially, and their measured contributions depend on the deal, period, return basis and bridge convention. Underwrite each driver explicitly instead of applying a market-wide percentage split.
When should a fund prioritize cost cuts over growth capex?
Treat sequencing as a deal-specific planning decision. Test whether a proposed cost action is truly removable and whether it protects customers, capacity and growth before using any savings to fund capex or acquisitions.
What’s a 100-day value-creation plan?
A detailed roadmap outlining the first quarter of operational, commercial, and financial actions post-close. It aligns management and investors on timing, accountability, and KPI targets for each lever.
What role does a managing director play in private equity value creation?
A managing director may sponsor the investment thesis, allocate resources and hold the team accountable, but the role and causal impact vary by firm and deal. Specific initiatives still require owners, evidence and measurable outcomes.
How important is post-merger integration in private equity?
Post-merger integration can materially affect whether an add-on thesis works. Test systems, customer retention, talent, cost, timing and governance rather than assuming the acquisition multiple itself creates value.
Why is regulatory compliance a challenge in private equity value creation?
Regulatory requirements can constrain an initiative, financing structure or exit. Any legal or regulatory conclusion must identify the jurisdiction, effective date and controlling authority; this guide does not provide legal advice.
How does strategic guidance support value creation in private equity?
Strategic guidance is useful only when it becomes testable choices, accountable initiatives and measured outcomes. Advice alone is not evidence of value creation.
How can private equity firms gain a competitive edge through talent management?
Talent changes may reduce execution or key-person risk, but the impact is company-specific. Underwrite the role, transition cost, decision rights and operating KPI that the change is meant to improve.
References:
- Graf, Kaserer & Schmidt – “Private Equity: Value Creation and Performance” (2012) – Global transaction evidence with a narrow financial-institution attribution method; useful only with its residual construction, fixed-leverage assumption and sample boundary visible.
- Guo, Hotchkiss & Song – “Do Buyouts (Still) Create Value?” (2011) – Large US public-to-private deals ending in 2006; operating gains, industry multiple changes and realized tax benefits are all economically important.
- Biesinger, Bircan & Ljungqvist – “Value Creation in Private Equity” (2020; revised 2023) – Mixed emerging-market evidence linking successful execution, rather than one ex-ante strategy, to gross deal outcomes.
- Füss, Morkoetter, Rainsborough & Tykvova – “Pricing, Returns, and Sources of Value Creation in Buyouts” (2025 working paper) – Proprietary transactions initiated through 2018; useful for the entry-pricing relationship, with key return and exit-date methods still unresolved in accessible metadata.
- Kärnä & Samantha Myers – “Plundered or profitably pumped-up?” (2025) – Swedish firm outcomes through 2022; a qualification to universal productivity claims, not sponsor-return attribution.
- Corporate Finance Institute – “LBO Returns Attribution: What Drives Equity Value” – Practitioner description of the standard terminal bridge; not evidence for portable contribution ranges.
- RSM Global – add-on acquisitions and multiple arbitrage (2022) – Practice context for the platform/add-on hypothesis; realized uplift still depends on integration, quality and exit evidence.
- CFA Institute – Enterprising Investor – “Tricks of the Private Equity Trade, Part 1” (2022) – Manager-reported bridge examples, treated here as marketing context rather than independent attribution evidence.
Apply these frameworks:
- Build the Model - quantify all three levers in a live LBO
- EV vs Equity Value - the bridge that connects entry valuation to your returns
- DPI: Why Cash Beats Paper - how LPs measure whether your value creation actually converted to distributions
- Private Equity Glossary - every term in this bridge, defined
Revision History
- : Reconciled the guide to a primary-source method review: removed portable IRR contribution bands and universal lever rankings, labeled synthetic examples, separated the clean terminal bridge from sponsor cash-flow returns, and added direct research citations.
- : Migrated to the new UpLevered platform: canonical reference template, named author byline, Article + FAQ schema. Embedded the interactive value bridge, repaired the mangled formula arrows, retired the stale static bridge image, and attributed the value-creation framework to Gompers and Kaplan.
- : Added TL;DR, value creation traps, bridge checklist, cross-links to EV guide
- : Fixed Matplotlib artifact, repaired citations, formatting cleanup
- : Original publication
Stay sharp. Subscribe to Deal Flow Bullet.
PE frameworks, deal analysis, and career intel for middle-market practitioners. Free, every two weeks.