
Fund Metrics · 22 min read · Updated June 2026
Private Equity DPI: The Liquidity Metric That Matters in 2026
DPI (distributions to paid-in) is how LPs actually measure PE returns. What good DPI looks like by vintage year, fund size, and strategy. 2026 benchmarks.
DPI vs. TVPI vs. RVPI - The Paid In Capital 60-Second Primer
Let’s cut through the jargon. In the world of private equity fund performance, three letters rule everything: DPI, TVPI, and RVPI.
Definitions (net of fees):
-
DPI (Distributions to Paid-In Capital) (also known as ‘distributed to paid’)
-
Realized cash returned to limited partners divided by total capital contributed.
-
DPI represents the ratio of cumulative distributions (or actual distributions) to capital paid (or paid-in capital) by the fund’s limited partners. It measures how much capital has been returned to investors relative to what they have paid in, and is a key indicator of the fund’s performance over its life cycle.
-
-
RVPI (Residual Value to Paid-In Capital)
- Unrealized net asset value of remaining investments divided by paid in capital
-
TVPI (Total Value to Paid-In Capital):
- DPI + RVPI = total performance including both realized and unrealized value
Note: Committed capital is the total amount investors agree to provide to a fund, but capital calls are made as investments are identified. DPI tracks distributions relative to capital paid (paid-in capital), not committed capital.
Mini example: Your private equity fund called $100 million from LPs, distributed $80 million in realized exits, and holds a remaining portfolio valued at $90 million.
-
DPI = $80M ÷ $100M = 0.80×. By late life, ≥1.0× is expected; earlier vintages can be below that without being a red flag.
-
RVPI = $90M ÷ $100M = 0.90×.
-
TVPI = ($80M + $90M) ÷ $100M = 1.70×.
DPI measures realized distributions and actual returns to investors, serving as a fund-level metric (unlike cash-on-cash return, which applies to individual investments). It is used to evaluate a fund’s performance and value creation for investors throughout the fund’s life cycle. DPI is a key metric for assessing a fund’s performance relative to how much capital has been called and paid by investors. The DPI value typically starts low early in the fund’s life and increases as cumulative distributions and actual distributions are made, making it important to track as the fund matures.
Why now: In a higher-rate regime where the time value of money matters again, timing and cash back beat paper mark-ups. IRR headlines raise eyebrows; DPI raises the next fund.
| Metric | What it measures | When it matters | Pitfalls |
|---|---|---|---|
| DPI | Cash-on-cash returns (cumulative distributions to capital paid) | Fundraising, LP liquidity needs, assessing fund’s performance over its life | Low early-stage, ignores remaining value |
| TVPI | Total economic value | Overall fund performance | Includes unrealized markups |
| RVPI | Unrealized upside | Portfolio construction decisions | Subject to marking volatility |
Sources (Definitions): ILPA Reporting Best Practices / ILPA Reporting Template (DPI/TVPI/RVPI definitions); Invest Europe Professional Standards (performance reporting).
The shift in investor focus is stark. Where LPs once celebrated high TVPI driven by portfolio markups, they now scrutinize DPI pacing like hawks. The reason? A large share of funds raised between 2015 and 2018 still haven’t returned investors’ initial capital, a dynamic Bain and PitchBook have both documented in recent liquidity analyses.
The Cash-vs-Paper Gap: Distribution Yield and Pacing
Absolute dollar distributions can rise while distribution quality deteriorates. Two pacing lenses matter most.
Distribution yield
Distributions during a period ÷ prior-year (or period-start) NAV.
Think of this as the dividend yield of your PE exposure.
Example: A fund sitting on $2.0B NAV that distributes $100M posts a 5% yield - decent, but hardly compelling given the illiquidity premium.
Two ways to read the “speed” of cash returns
Annualized distribution rate (ADR) - LP convention
-
Formula: ADR = period distributions ÷ period-start NAV
-
Use: Cash-yield speedometer for the current year/quarter.
-
Example: Starts 2026 at $1.0B NAV, distributes $120M in 2026 → ADR ≈ 12%.
DPI Pace (DPIP) - lifecycle pacing heuristic
-
Formula: DPIP = cumulative DPI ÷ fund age (years)
-
Use: Compare lifecycle pacing across funds of different ages (percentage of paid-in capital, not NAV).
-
Example: 7-year-old fund with 1.40× DPI → 1.40 ÷ 7 = 0.20×/yr = 20% of paid-in per year.Note: DPIP ignores timing/compounding - it’s not a return metric, just pacing.
Quick rule: Use ADR to judge this period’s cash yield; use DPIP to compare lifecycle pacing across vintages.
Pacing & liquidity metrics - quick summary
| Metric | What it tells you | Formula (clean) | Denominator | Time lens | Best for | Watch-outs | Example |
|---|---|---|---|---|---|---|---|
| ADR / Distribution yield | Current-period cash yield on your NAV | period distributions ÷ period-start (or prior-year) NAV | NAV | Quarterly / yearly | Comparing cash yield across funds & years | NAV can be marked; rising NAV can make yield look smaller; not a return metric | Start NAV $2.0B , dists $100M → 5% |
| DPI Pace (DPIP) | Average cash-back speed over life | cumulative DPI ÷ fund age (years) | Paid-in capital | Lifecycle | Cross-vintage pacing sanity check | Ignores timing/compounding; not a return | 1.40× DPI at 7 yrs → 0.20×/yr (≈20% of paid-in per year) |
| DPI | Realized multiple (cash returned) | cumulative distributions ÷ paid-in capital | Paid-in capital | Cumulative | “Have you paid me back yet?” | Ignores unrealized; vintage-age context matters | $140M dists on $100M paid-in → 1.40× |
| TVPI | Total multiple (cash + paper) | (cumulative dists + NAV) ÷ paid-in | Paid-in capital | Point-in-time | Sizing total value | Can look great while DPI lags | ($80M + $90M) ÷ $100M = 1.70× |
Use ADR / distribution yield to judge this period’s cash, DPIP for lifecycle pacing, DPI for realized outcomes, and TVPI for the full picture.
Reality check
Industry distributions rebounded in 2023–2024 but were concentrated in large-cap exits. Many 2020–2022 vintages still show low single-digit ADRs.
Net-flow nuance
Positive aggregate cash flows can mask individual fund struggles. A core middle-market fund might be distributing minimally while mega-fund exits lift the industry totals. Tracking cumulative distributions and DPI/DPIP at the fund level reveals whether your capital is actually coming back - or just riding headline trends.
Mid-life DPI guideposts - buyout / MM (indicative)
Use these ranges to set expectations. Calibrate to your LP base and add dated survey data where available.
| Vintage age | DPI sanity check | Notes |
|---|---|---|
| Year 3 | Low DPI is normal | Still investing / early realizations; watch ADR trend more than the DPI level. |
| Year 5 | ~0.3×–0.6× typical | Sector / market dependent; continuation deals can skew. |
| Year 7 | ~0.5×–0.8× often expected | Below this, LPs start gating re-ups; check source/quality of DPI. |
| Year 10+ | ≥ 1.0× common target | If < 1.0× late-life, explain exit plan, toolkit, and timing clearly. |
Source. Indicative ranges synthesized from LP re-up practices and surveys; see Bain & Company Global Private Equity Report 2025 (pacing/distribution context), Coller Capital Global Private Equity Barometer 2025 (LP re-up criteria), and Preqin Investor Outlook 2025 (allocation & pacing constraints).
LP behavior. Re-ups are increasingly gated by mid-life DPI milestones. Many LPs look for roughly 0.5×–0.8× DPI by Years 5–7 for buyout (strategy/market dependent). Miss the pacing window and expect harder allocation conversations. Tailor to your LP base and add dated survey data where available.
Pacing snapshot - industry aggregates (sourced)
In 2024, US buyout/PE funds flipped back to positive net cash flow: distributions of $174B exceeded capital calls of $143B (net + $31B). That reversal, however, rode a slowdown in new investing rather than a broad reopening of exits - and the distribution yield (cash out ÷ NAV) remains historically lean. Bain pegs global PE distribution yield at ~11% in 2024, the lowest in more than a decade, versus ~29% in 2014–2017. That’s the cash-vs-paper gap LPs feel day-to-day.
| Year | Capital Calls ($B) | Distributions ($B) | Net Flow ($B) | Source |
|---|---|---|---|---|
| 2022 | 207 | 143 | −64 | Cambridge Associates, US PE/VC Benchmark (CY-2024 commentary) |
| 2023 | 150 | 127 | −23 | Cambridge Associates, US PE/VC Benchmark (CY-2024 commentary) |
| 2024 | 143 | 174 | +31 | Cambridge Associates, US PE/VC Benchmark (CY-2024 commentary) |
| 2025 H1 | — | - | Net positive (directional) | Bain & Company, GPER 2025 / Mid-Year Outlook (context) |
Source. Cash-flows: US (Cambridge Associates, CY-2024 commentary). Yield benchmarks: Global (Bain & Company, GPER 2025). Scopes differ.
Distribution yield benchmarks (global, sourced)
- 2014–2017 average: ~29% (global buyout) - Bain & Company, Global Private Equity Report 2025
- 2024: ~11% (global private equity) - Bain & Company, Global Private Equity Report 2025
Methods note. Cash-flow table is US (Cambridge Associates). Yield benchmarks are Global (Bain). Scopes differ, so use the table to show direction (net flow) and the benchmarks to show magnitude of today’s cash-vs-paper gap. • Last checked: Sept 2025.
Takeaway: Don’t get fooled by industry headlines. Track your fund’s distribution yield and compare it to vintage peers, not the aggregate market.
The Great Elongation: why holds are longer
Median hold periods on exited deals pushed to records in 2023 and eased only modestly in 2024, while the current portfolio age of unsold assets remains elevated - putting forward pressure on exits and future DPI. Remember: unrealized value (RVPI) is theoretical until converted to cash. As assets exit, RVPI falls and DPI rises - that’s the pipe you’re trying to unclog
What to watch: two lenses. (1) Exited holds tell you how long realized deals took; (2) Current portfolio age tells you how old today’s unsold inventory is - and how crowded the exit queue may get. In the US, exited holds fell from a 7.0-year peak (2023) to 5.8 years (H1-2024), but current-age stayed high at 4.2 years at YE-2023 - evidence that the backlog remains (sourced from PitchBook).
Why this is happening: multiple compression, wide bid–ask spreads, higher financing costs, a thin IPO window, and selective sponsor-to-sponsor activity - plus the feedback loop: Longer holds → slower DPI → tougher fundraising → fewer sponsor buyers → longer holds.
Vintage stacking: continuation vehicles blur “clean” vintage diversification. A 2019 allocation can end up exposed to 2019/2020/2022 performance as positions roll into CVs; map overlap risk explicitly.
Hold periods - exited US PE-backed companies
| Period | Median hold |
|---|---|
| 2019 (baseline) | ~5.5 years |
| 2023 (full-year) | 7.0 years (peak) |
| 2024 H1 | 5.8 years |
| 2025 H1 (optional) | ~6.0 years |
Sources: Commonfund, PitchBook (US), Juniper Square
Current portfolio age - unsold US PE-backed companies
| As-of | Median age | Notes | Source |
|---|---|---|---|
| YE-2023 | 4.2 years | ~11,059 US companies; 11-year high | PitchBook post (US). Facebook |
Sources: PitchBook Post
Scope notes: Holds table = US; current-age = US. Do not mix with global backlog figures.
For the broader context, global buyout still sits on ~29,000 unsold companies with ~$3.6T of unrealized value (2024 YE) per Bain.
Where windows remain open. Activity has been firmer in software/IT services and healthcare, and carve-outs are trending up as corporates shed non-core units - use these channels to pry open exit optionality. (Bain, Financial Times, S&P Global)
Takeaway: rising portfolio age = a growing exit queue. Without a credible plan to convert RVPI into DPI (clean exits or high-governance liquidity tools), you invite pacing risk, tougher re-ups, and crowded sale windows.
The GP Liquidity Toolkit (and LP Optics): What Actually Boosts DPI
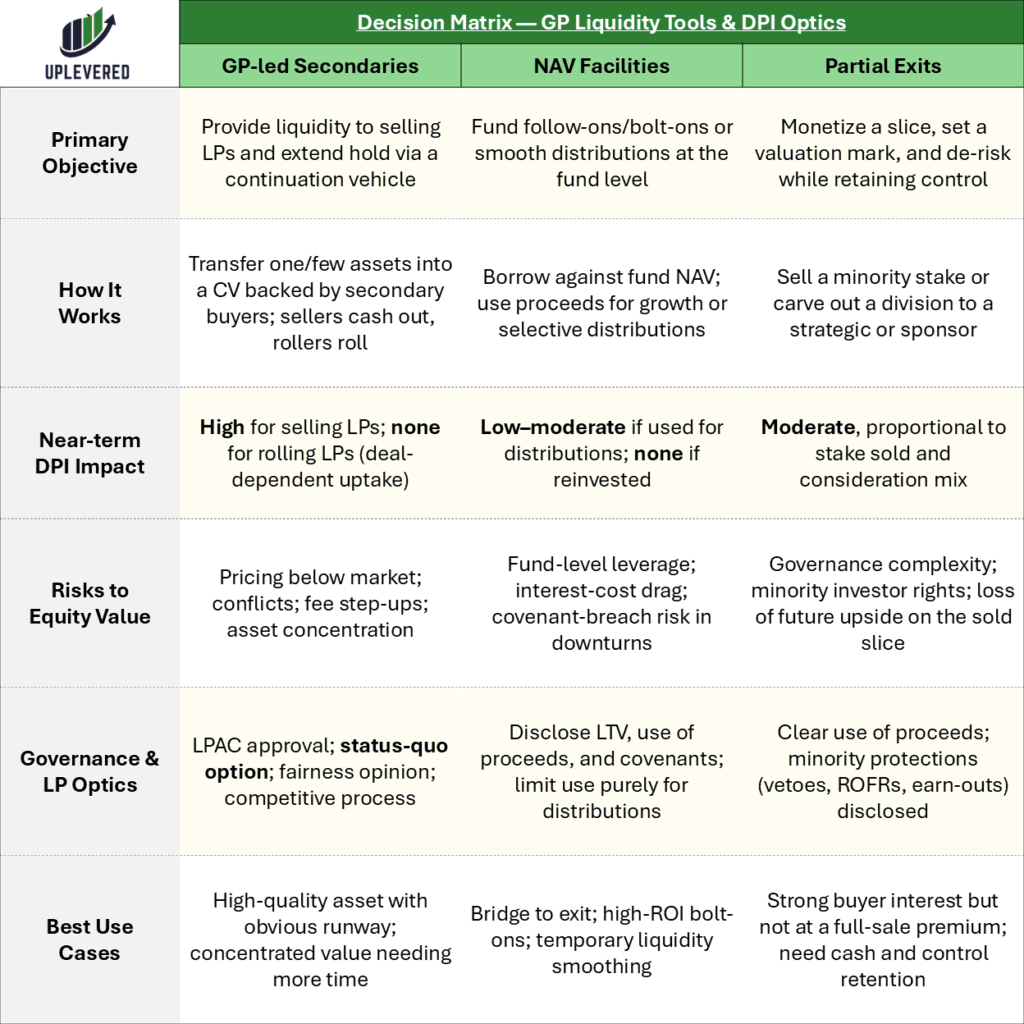
The days of “wait for the perfect exit” are over. Today’s GPs deploy a sophisticated liquidity toolkit to accelerate DPI while managing value preservation. Here’s what actually moves the needle:
Timing matters: Earlier cash reduces reinvestment risk and pacing pressure; engineered cash (NAV/recaps) adds leverage risk and future drag.
Continuation Vehicles (GP-Led Secondaries)
Facts: H1 2025 total secondary volume: ~$102–103B (record first half). GP-led volume: ~$48B; ~47% of total. LP-led pricing (buyout stakes): ~90% of NAV average in H1 2025.
Use case: Exit path for “winners” with remaining operational runway. Rather than selling to a strategic buyer at today’s compressed multiples, move the asset to a new vehicle where existing LPs can roll or cash out.
DPI impact: Real liquidity for LPs who elect to sell, while believers can roll their equity position. For the selling LPs, this counts as full DPI realization.
LP optics: Conflicts abound. Price discovery, LPAC process integrity, and the status quo option (per ILPA guidelines) are critical. LPs scrutinize: Was this a fair process? Did we have meaningful alternatives?
Quality signals: Breadth of bidders, pricing vs last NAV, independent fairness opinion, status quo option, and clear disclosure of GP economics in the new vehicle.
Sources: Evercore H1 2025 Secondary Market Review (PDF) • Jefferies Global Secondary Market Review 2025 (PDF) • Lazard Secondary Market Report 2024 (PDF) • ILPA GP-Led Secondary Fund Restructurings (Guidance)
NAV Facilities (Fund-Level Leverage)
Market size ~$150B today; expected to double within ~2 years (S&P Global via Bain 2025). Partners Group/FFA and Rede also place current size at ~$100–150B with growth paths toward $600B by 2030. Use these as directional bookends depending on your narrative.
Use case: Bridge financing for follow-on investments or selective distribution acceleration. Think of it as a credit line secured by portfolio company values.
DPI impact: Depends entirely on use of proceeds. NAV lines used for distributions to LPs boost DPI immediately, but at the cost of additional leverage and interest expense.
LP optics: Loan-to-value ratios, covenant structures, disclosure practices, and cost drag matter. Many LPs now demand explicit policy limits on using NAV facilities for distributions vs. growth capital.
Sources: Rede Partners - NAV Financing Market Report 2025 • Bain & Company - Global Private Equity Report 2025
Dividend Recapitalizations
Facts:$22.4B of US dividend recaps in the first seven weeks of 2025 (LCD), signaling a robust return of recap-funded DPI
Use case: De-risk MOIC while allowing portfolio companies to compound. Pull out initial invested capital (or more) via debt-funded dividends while retaining equity upside.
DPI impact: Immediate cash to LPs, but at the cost of higher portfolio company leverage and potential value destruction if poorly timed.
LP optics: Free cash flow coverage, covenant headroom, and preservation of growth capex are key. Sophisticated LPs distinguish between “good” recaps (excess cash distribution) and “bad” recaps (leveraging for the sake of DPI).
Sources: Dechert - Dividend Recaps in 2025 (LCD-cited volumes) • Bain & Company - Global Private Equity Report 2025
Partial Exits & Minority Sell-Downs
Sponsor-to-sponsor exits +141% YoY in 2024 (to $181B), explaining most of the exit rebound; IPOs stayed tiny
Use case: Incremental DPI, fresh valuation marks, and risk reduction while retaining control and upside participation.
LP optics: Why partial now vs. waiting for a full-sale premium? Usually signals either liquidity pressure or genuine price discovery in advance of a broader exit process.
Sources: Bain & Company - Global Private Equity Report 2025 • EY - Private Equity Pulse (H1 2025 exits/market window)
| Tool | DPI Impact | Risk to Equity | LP Optics / Governance | Best Use Case |
|---|---|---|---|---|
| GP-Led CV | High (for sellers) | Medium | Complex (conflicts) | Winners with runway |
| NAV Facility | Variable | Medium | Disclosure critical | Bridge / follow-ons |
| Dividend Recap | High | High | Coverage analysis | Excess cash extraction |
| Partial Exit | Medium | Low | Timing rationale | Risk reduction |
Section sources: Evercore H1 2025 • Jefferies 2025 • Lazard 2024 • ILPA guidance • Rede Partners 2025 • Dechert (LCD) • Bain 2025 • EY PE Pulse
Quality of DPI > Quantity: Example Fund Performance Scoring Rubric for LPs
Not all DPI is created equal. Sophisticated limited partners increasingly audit the source and sustainability of distributions using frameworks like this five-factor quality score:
Source taxonomy: Strategic exit, sponsor-to-sponsor sale, continuation vehicle cash-out, NAV-funded distribution, dividend recap, escrow releases, monitoring fee refunds - each carries different risk and repeatability profiles.
Five-factor DPI Quality Score (0–5 each):
1. Source (exit vs engineered)
-
5: Strategic sale or IPO
-
3: Sponsor-to-sponsor transaction
-
1: Dividend recap or NAV-funded distribution
-
0: Fee rebates or escrow releases
2. Pricing vs NAV (for CVs/LP-leds)
-
5: >20% premium to last mark
-
3: At or near NAV
-
1: Discount to NAV
-
0: Material discount (>15%)
3. Post-event balance-sheet resilience (recap stress)
-
5: <3× debt/EBITDA post-transaction
-
3: 3-5× debt/EBITDA
-
1: 5-7× debt/EBITDA
-
0: >7× debt/EBITDA or covenant concerns
4. Repeatability (one-off vs programmatic)
-
5: Part of systematic exit program
-
3: Opportunistic but logical timing
-
1: Forced by fund constraints
-
0: Fire sale or distressed circumstances
5. Governance (LPAC, fairness, disclosure)
-
5: Full LPAC approval, fairness opinion, competitive process
-
3: LPAC consultation, adequate disclosure
-
1: Notification only, limited transparency
-
0: Post-facto disclosure or GP conflicts
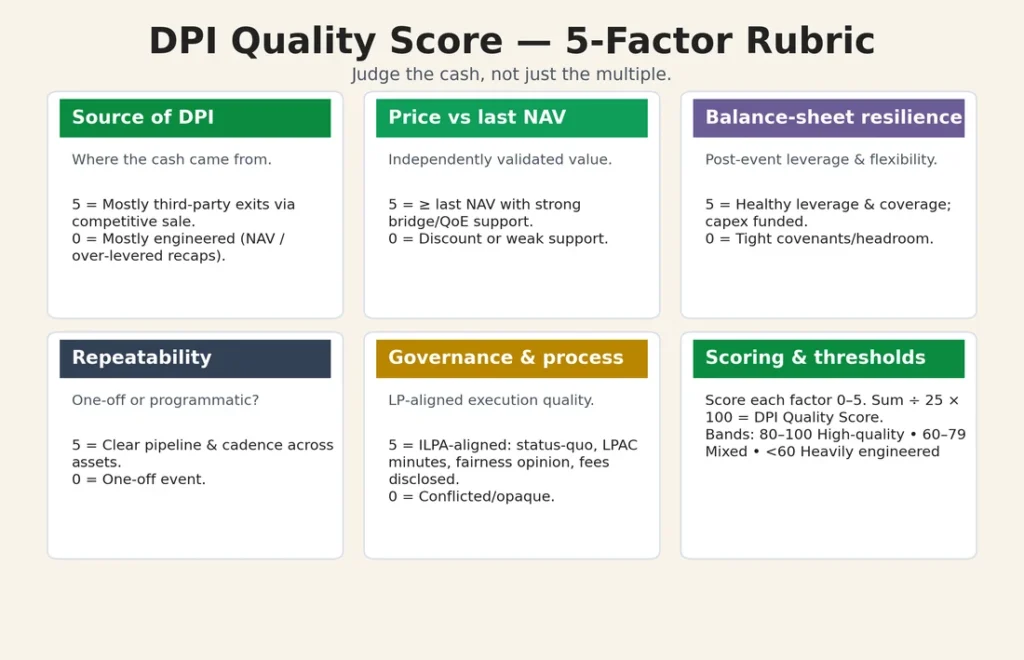
Methods (DPI quality score): Score 0–5 each for source, price vs last NAV (with bridge/QoE), balance-sheet resilience, repeatability, governance; sum/25 × 100. Governance aligned to LPA process, fairness opinion / conflicts, and fee transparency.
Total scores:
-
20-25: Premium DPI (count it fully in performance analysis)
-
15-19: Solid DPI (weight appropriately in peer comparisons)
-
10-14: Questionable DPI (dig deeper on sustainability)
-
<10: Manufactured DPI (discount heavily in evaluations)
The key insight: LPs now regularly ask GPs to break down DPI by source and quality score. A fund with 1.2× DPI might score poorly if most distributions came from leveraged recaps, while a fund with 0.9× DPI from clean strategic exits might rank higher.
Benchmarks That Actually Help
Industry medians mask significant variation by fund characteristics. Here’s how to actually evaluate DPI performance:
By vintage age: Year 3 low DPI is completely normal as the J-curve plays out. Year 7+ low DPI is a red flag indicating either poor asset selection or market timing issues.
By fund type: Buyout funds should show meaningful DPI by year 5-6. Growth funds typically lag by 1-2 years. Venture capital DPI can remain minimal until year 8+ due to longer development cycles.
By market bucket: Middle-market and lower-middle-market funds often show steadier DPI progression due to simpler exit processes, while mega-funds can be lumpier with massive single-asset exits. The current market value of remaining assets can significantly affect DPI progression, as funds with higher unrealized value may show lower DPI compared to peers, even if overall performance is strong.
By geography: European funds often show slower early net DPI under whole-fund (European) waterfalls; US deal-by-deal waterfalls can accelerate GP carry and slightly reduce early net DPI.
| Vintage Age | MM Buyout DPI Range | Growth DPI Range | Notes |
|---|---|---|---|
| Year 3 | 0.1-0.3× | 0.0-0.2× | J-curve minimum |
| Year 5 | 0.4-0.7× | 0.2-0.5× | Early exits begin |
| Year 7 | 0.8-1.2× | 0.5-0.9× | Mid-life gate |
| Year 10+ | 1.1-1.8× | 0.8-1.5× | Mature performance |
Context matters enormously. A 2020 vintage fund with 0.3× DPI in 2026 might be perfectly normal given market conditions, while a 2017 vintage fund with the same DPI would be concerning.
Diligence Checklists (Copy-Paste)
For LPs (Re-Up Filter)
DPI pacing analysis
-
DPI by vintage vs peer funds in the same vintage year
-
ADR trend (annualized distribution rate) over the last 8 quarters
-
Comparison to the GP’s prior fund DPI at the same age
Distribution source breakdown (last 12–24 months)
-
% from strategic exits vs sponsor-to-sponsor vs engineered liquidity (CVs/NAV/recaps)
-
Average DPI Quality Score by transaction
-
Concentration: % of DPI from top 3 exits
Continuation vehicle governance pack
-
Status quo option offered (roll on existing fund terms; no coercion)
-
LPAC approval and meeting minutes for the GP-led process
-
Independent fairness opinion - scope, methodology, conclusions
-
Bidder list & competition - number of bids, final-round participants, auction evidence
-
Price vs last NAV - bridge from prior mark; QoE/valuation support; adjustments
-
Independent valuation/QA (third-party review or valuation agent)
-
GP rollover & alignment - % GP equity/carry rolled; any new carry; co-invest terms
-
Fees & expenses in the CV - base, rate, fee holidays/tiering; expense caps; banker/adviser fees disclosed
-
Conflicts memo & waivers - related-party roles, stapled commitments, side letters summarized
-
Terms parity for rollers - economics, governance rights, MFN where applicable
-
Election timeline - ≥20 business days; full data-room access; clear Q&A process
-
Use of proceeds & follow-on plan - distribution vs reinvest; reserves policy
-
Financing terms (if any) - NAV/subscription lines, LTV, covenants, use-of-proceeds limits
-
Indemnities/escrows & tax - key protections; tax leakage analysis
-
Post-close reporting - cadence, KPIs, valuation policy in the CV
NAV line terms and usage
-
Loan-to-value (LTV) and covenant headroom
-
Written policy on use of proceeds (distribution vs investment)
-
Interest-cost drag on net returns (modeled)
-
Disclosure frequency and transparency
Distribution forecast (next 12–18 months)
-
Asset-by-asset exit probability and timing
-
Sensitivity analysis for market conditions
-
Cash-flow modeling at the portfolio-company level
-
Refinancing needs and debt-maturity calendars
For GPs (What to Communicate)
Distribution pacing targets
-
Expected DPI milestones by fund age
-
Asset-by-asset exit catalysts and probability assessments
-
Scenario planning for base/upside/downside market conditions
Policy clarity
-
Written guidelines on NAV facility usage for distributions
-
Dividend-recap evaluation criteria and guardrails
-
GP-led transaction governance and conflict-management policy
Process integrity
-
Continuation-vehicle rationale and LP optionality
-
Independent oversight and fairness-opinion requirements
-
Transparent rollover economics and GP alignment
Modeling the Liquidity Tools - Worked Examples
Assume one fund, $100M paid-in, $150M NAV before any action. Multiples are net of fees/carry; ignore frictional costs for clarity.
Baseline (for reference)
-
DPI = $0 ÷ $100M = 0.00×
-
RVPI = $150M ÷ $100M = 1.50×
-
TVPI = 0.00× + 1.50× = 1.50×
A) Clean strategic exit
Distribute $180M; residual NAV $40M.
-
DPI = $180M ÷ $100M = 1.80×
-
RVPI = $40M ÷ $100M = 0.40×
-
TVPI = 1.80× + 0.40× = 2.20×
B) Dividend recap (no change in EV)
Portfolio company adds debt and pays a $60M dividend; equity value drops by the same amount → NAV $90M.
-
DPI = $60M ÷ $100M = 0.60×
-
RVPI = $90M ÷ $100M = 0.90×
-
TVPI = 0.60× + 0.90× = 1.50×
Recaps and NAV loans re-time cash (DPI ↑, RVPI ↓) with TVPI flat pre-costs. The value question is whether added leverage and interest drag are justified by runway and cash-flow coverage.
C) NAV-funded distribution (fund-level loan)
Borrow $30M against fund NAV; distribute $30M; assets ~flat, liabilities up → NAV $120M.
-
DPI = $30M ÷ $100M = 0.30×
-
RVPI = $120M ÷ $100M = 1.20×
-
TVPI = 0.30× + 1.20× = 1.50×
Pre-costs, TVPI is unchanged; interest expense is a drag on future net returns. Adds fund-level leverage and covenant risk.
-
Misreading recycling provisions (re-invested distributions don’t count toward DPI)
-
Ignoring escrow holdbacks that may never be released
-
Double-counting monitoring fees refunded as distributions
Counterpoints & When Patience Wins
Let’s be realistic: not every situation calls for liquidity acceleration. Smart GPs know when to hold.
Case logic for patient capital: Holding through rate cycles can be value-accretive if the underlying business is growing faster than the cost of delay. Operational value creation timelines - think digital transformation or international expansion - don’t always align with market windows.
Open windows still exist: Sponsor-to-sponsor transactions continue to clear in software/IT services, healthcare services, and business services where strategic rationale remains strong. Corporate carve-outs are actually increasing as strategic buyers shed non-core assets.
Quality vs. timing trade-offs: Forcing a suboptimal exit to goose DPI can destroy more value than the liquidity benefit provides. Sophisticated LPs understand this nuance and prefer transparency about timing over manufactured distributions.
The key is communication. LPs can tolerate extended holds if GPs proactively explain the value creation thesis, provide realistic exit timelines, and demonstrate progress against operational milestones.
2026–2027 Signposts: What Will Actually Move DPI
Four factors will determine whether the distribution drought continues or breaks:
Rates path and financing costs: Every 100 basis points of rate relief expands the buyer pool and narrows bid-ask spreads. Watch the 10-year Treasury and credit spreads for early signals.
Private credit health: Default rates and spread widening in the private credit markets will force portfolio company refinancings and potentially distressed exits. Monitor direct lending fund performance as a leading indicator.
First-wave GP-led continuation vehicle exit outcomes: The vintage 2020-2021 assets moved into continuation vehicles in 2023-2024 will start exiting in 2026-2027. These outcomes will validate (or destroy) the CV model for future use.
Fundraising concentration and manager consolidation: If only the top-quartile GPs can raise new funds, we’ll see more manager consolidation, team departures, and potentially fire-sale exits from struggling funds.
The smart money is positioning for a bifurcated market: high-quality assets in the right sectors will find exits, while everything else remains stuck in portfolio purgatory.
FAQ
Is high TVPI with low DPI a red flag?
Not automatically, but it warrants scrutiny. For funds younger than 5 years, high TVPI with minimal DPI is normal due to the J-curve. For mature funds (7+ years), a large gap between TVPI and DPI suggests either aggressive marking practices or a portfolio full of assets that can’t find exits at marked values.
Do dividend recaps “manufacture” DPI?
Yes and no. Recaps using excess cash flow represent real value extraction and legitimate DPI. Recaps that over-leverage portfolio companies for the sake of boosting DPI metrics are manufactured and unsustainable. The distinction lies in post-transaction leverage levels and cash flow coverage.
How do NAV lines affect LP returns and DPI optics?
They accelerate DPI timing but don’t create value - borrowing against future exits. Typical terms: SOFR + ~350–650 bps, LTV ~15–30%, with covenants; cost drag lowers net returns unless proceeds fund accretive follow-ons. (Sources: Rede Partners 2025; Bain 2025.)
European vs American waterfalls - do they change DPI timing?
Yes. American (deal-by-deal) crystallizes carry per deal, often trimming early net DPI to LPs. European (whole-fund) defers carry until all contributions + pref are returned, usually boosting early net DPI. (Sources: ILPA Principles/Reporting; LPA market practice.)
What’s a good DPI by year 7 for middle-market buyout?
Rule of thumb: ~0.8×–1.0× is “on track.” <0.8× needs a clear path to realizations; >1.2× is strong for the vintage/sector. Benchmark against true vintage peers. (Sources: Bain 2025; LP/manager surveys.)
Sources & Methodology
Methodology: Multiples are net of fees and carry unless noted. Distribution yield and ADR are period-based; DPIP is defined here as cumulative DPI ÷ fund age. All stats are dated and sourced in-line.
Distribution yield and annualized distribution rate calculations are estimates based on aggregate industry data and may not reflect individual fund performance. All figures reflect net-of-fee returns to limited partners unless otherwise noted. DPI quality scoring framework is based on institutional LP best practices and ILPA governance guidelines.
- Cambridge Associates - US PE/VC Benchmark Commentary (CY-2024): calls, distributions, net flow (US scope).
- Bain & Company - Global Private Equity Report 2025: distribution yield, backlog, fundraising, exit mix (Global scope).
- PitchBook - US PE hold medians (2019–H1 2024) and YE-2023 median current-age.
- Evercore (H1-2025), Jefferies (2024/2025), Lazard (2024) - secondaries volume/share, pricing vs NAV.
- Rede Partners 2025 - NAV finance market size, spreads, LTV, disclosure norms.
- S&P Global LCD / Dechert 2025 - US dividend recap volumes (2024–2025).
- EY PE Pulse H1-2025 - exit channel shares/windows.
- ILPA - GP-Led Secondary Guidance; Reporting Best Practices.
Scope notes: Cash-flow tables are US (CA). Yield/backlog are Global (Bain). Holds/age tables are US (PitchBook). Secondaries are Global (Evercore/Jefferies/Lazard).
Updated: data last refreshed September 2025 (hold periods, portfolio age, distribution yield, GP-led volumes); migrated to the new platform June 2026
Revision History
- : Migrated to the new UpLevered platform: canonical reference template, named author byline, Article + FAQ schema; resolved duplicate in-page anchor ids (cash-vs-paper, benchmarks) - first occurrence keeps the anchor.
- : Last pre-migration update.
- : Original publication.
Stay sharp. Subscribe to Deal Flow Bullet.
PE frameworks, deal analysis, and career intel for middle-market practitioners. Free, by email.