Understanding enterprise value vs equity value separates competent analysts from those who fumble through deal discussions. These two fundamental valuation metrics measure different aspects of company value, yet confusion between them derails countless investment committee presentations and M&A negotiations.
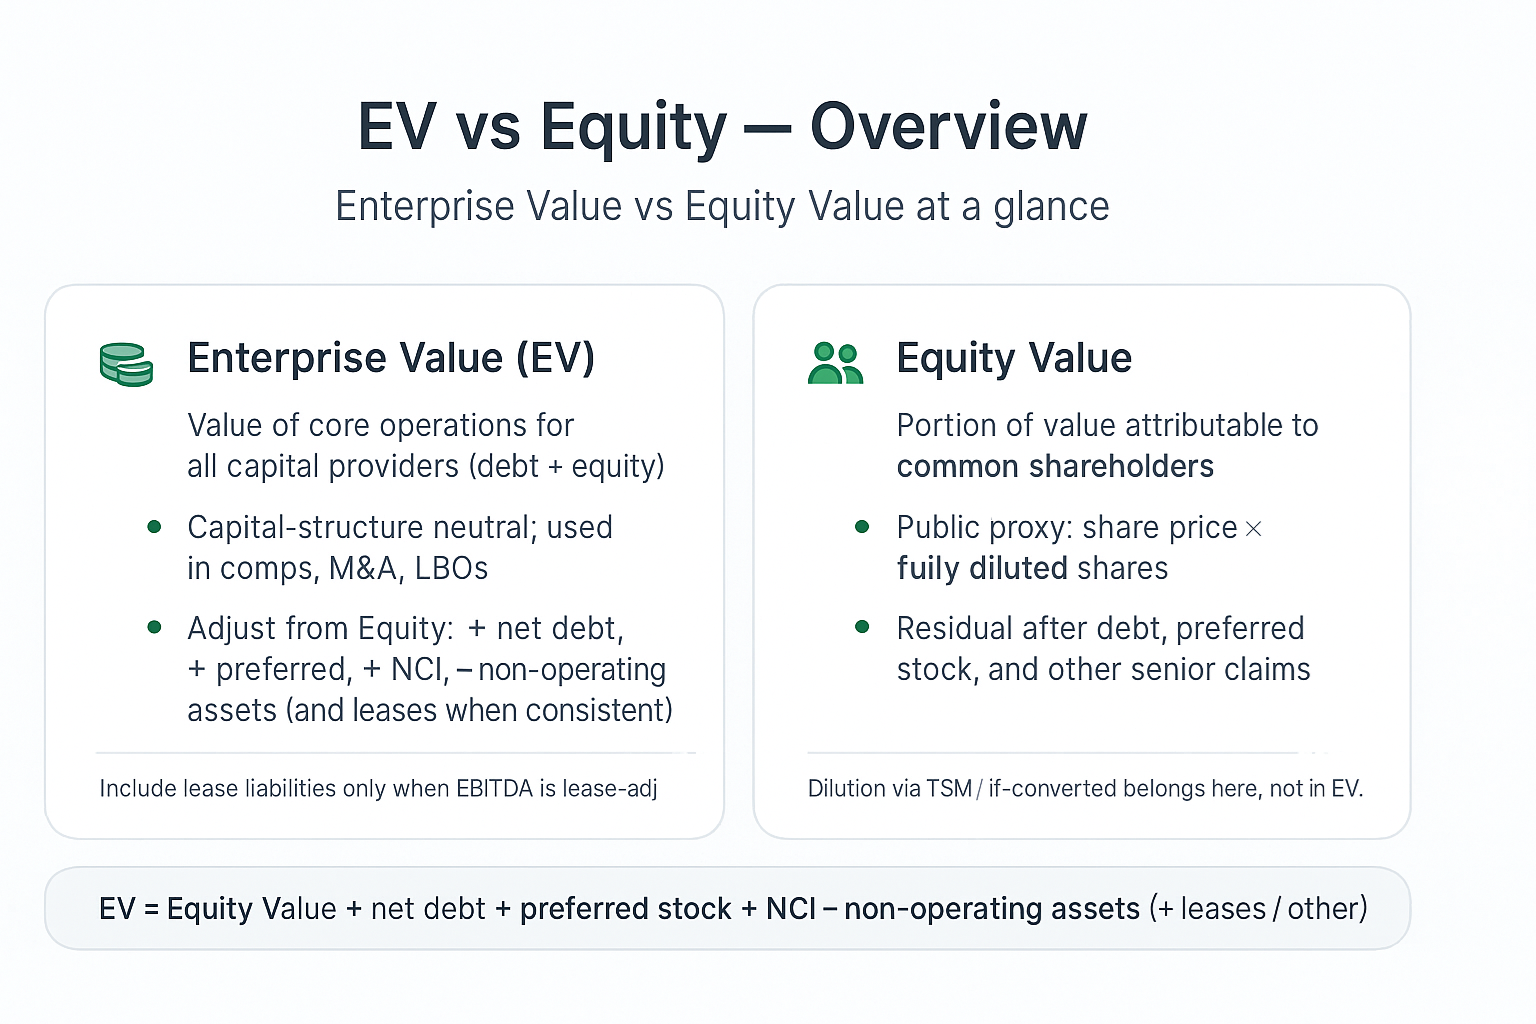
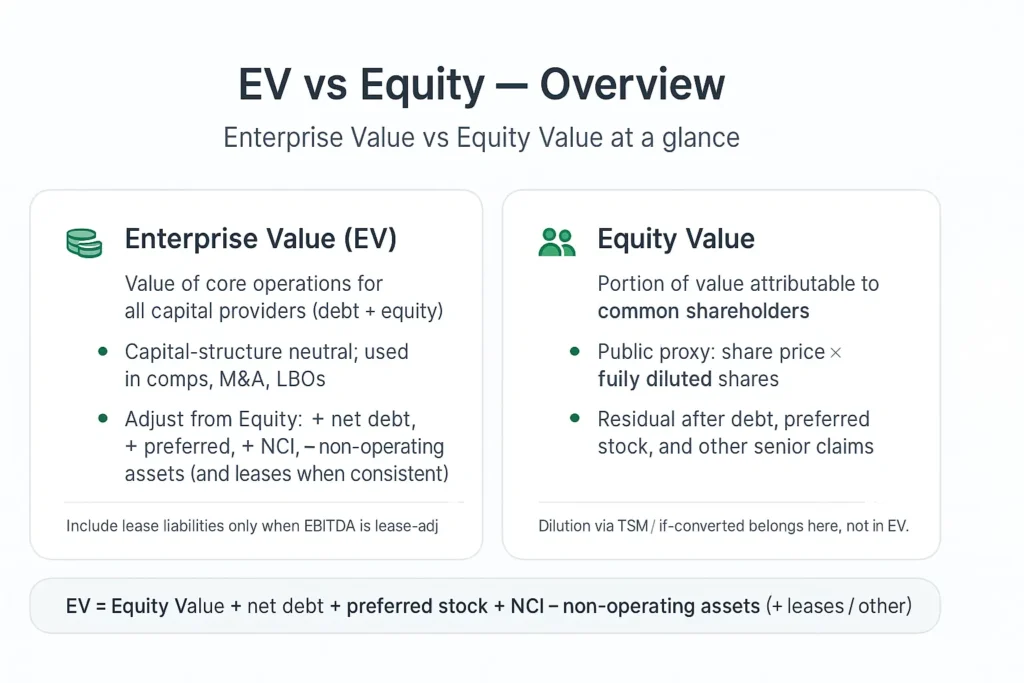
Enterprise Value (EV) captures the value of a company’s core operations available to all capital providers. Equity Value captures only the portion attributable to common shareholders. The bridge between them reveals capital structure and drives how we compare companies, price M&A, and build LBOs.
We explain enterprise value versus equity value to reinforce how each metric serves a different purpose in valuation. Whether you’re building LBO models or comparing public companies, mastering these concepts is non-negotiable.
| Dimension | Enterprise Value (EV) | Equity Value |
|---|---|---|
| Definition | Value of core operations to all capital providers | Value attributable to common shareholders |
| Formula (typical) | Equity Value + Net Debt + Preferred + NCI (+ leases, debt-like) − non-ops | Share price × fully diluted shares |
| Capital structure impact | Neutral | Directly impacted by leverage |
| Primary users | M&A, comps, LBO | Shareholders; FIG valuation |
| Common multiples | EV/EBITDA, EV/EBIT, EV/Sales | P/E, P/B(TBV) |
Quick differences (at a glance)
- Scope: EV = value of the whole business for debt and equity, representing the entire value of the business; Equity = value for common shareholders only.
- Capital structure: EV is neutral to leverage; Equity is sensitive to leverage.
- Formulas: EV bridges from Equity (EV = Equity + Net Debt + Preferred + Non-controlling Interests ± leases/debt-like − non-operating assets); Equity = price × fully diluted shares.
- Multiples: EV/EBITDA, EV/EBIT, EV/Sales vs P/E, P/B(TBV).
- Use cases: EV for comps/LBO/M&A; Equity for shareholder metrics (P/E) and FIG sectors.
TL;DR: Enterprise Value vs Equity Value
Before your next comp set or IC memo, use this as your EV bridge sanity check. If any of these are unfamiliar, read the full section below.
- Enterprise Value (EV): value of core operations attributable to all capital providers (debt + equity); often referred to as the firm’s value or overall value.
- Equity Value: value attributable only to common shareholders.
- Standard EV Bridge: EV = Equity Value + Net Debt + Preferred + NCI (+ leases/other debt-like) − Non-operating assets.
- New to LBO modeling? Start with our 5-step LBO guide → How to Build an LBO Model.
What is Enterprise Value?
- Definition: Value of a company’s core business operations attributable to all capital providers (debt + equity).
- Takeover lens: Approximates the theoretical cost to acquire 100% of the business (buy equity, assume/refinance debt, receive cash).
- Capital-structure neutral: Comparable across companies with different leverage.
- What it includes: Debt, preferred, non-controlling interests, and lease liabilities when EBITDA is lease-adjusted.
- What it excludes: Cash and non-operating assets (they don’t drive operating metrics like EBITDA).
- Common Multiples: EV/EBITDA, EV/EBIT, EV/Sales.
Enterprise value represents the total value of a company’s core operations and its net operating assets. Think of it as the theoretical price tag for acquiring 100% of a business, including all its operational assets and assuming responsibility for its debts.
An acquirer can essentially pay the equity holders for their shares, assume the debt obligations, and receive any cash on the balance sheet. This makes enterprise value the most relevant metric for M&A analysis and operational comparisons.
EV is capital-structure neutral, making it useful for comparing firms with different debt levels. Even if two companies have a different financing structure, such as one being financed with 90% equity and another with 50% debt, a company with $500 million in enterprise value has the same operational worth. This neutrality makes EV multiples like EV/EBITDA the gold standard for benchmarking.
EV includes all capital claims on the business. This encompasses debt, preferred stock, non-controlling interests, and lease liabilities when consistent with the EBITDA calculation. Each represents a claim on the company’s cash flows that an acquirer must address.
EV excludes cash and non-operating assets, explicitly excluding cash from the calculation to focus on operational assets. Cash reduces the net acquisition cost, while non-operating assets like marketable securities or real estate holdings don’t contribute to the company’s core business operations.
What is Equity Value?
- Definition: Value attributable to common shareholders.
- Public proxy: Share price × fully diluted shares (TSM for options/warrants; if-converted for in-the-money convertibles).
- Residual claim: Equity sits after debt and preferred claims.
- Dynamics: Moves with share price and dilution (options, RSUs, convertibles).
- One-liner guardrail: Equity Value ≠ basic Market Cap — always use fully diluted shares.
- Multiples: P/E, P/B(TBV) (especially in FIG).
Equity value measures the market value of common equity in a business. It is also referred to as the value of the company’s equity or firm’s equity, and it represents the value of the company’s shares. For public companies, this starts with market capitalization but requires careful adjustment for dilutive securities and capital structure complexity.
The public proxy uses share price × fully diluted shares outstanding, not just basic market cap. This distinction matters when companies have significant option pools, convertible debt, or warrant overhang. Basic share count ignores these dilutive effects. Equity value is what is attributable to equity investors, as it reflects the portion of the company’s value that belongs to holders of the company’s shares.
Equity value represents the residual after satisfying senior claims like debt and preferred stock. Common shareholders get paid last in the capital structure, so equity value reflects what remains after all senior obligations are met—this is also known as the net asset or net asset value available to shareholders after debts are settled.
Equity value moves with stock price and dilution from options, RSUs, and convertible securities. A company’s enterprise value might stay constant while equity value fluctuates based on market sentiment or changes in shares outstanding. The equity value formula is typically: Equity Value = Enterprise Value – Debt + Cash (and equivalents) – Preferred Stock – Non-controlling interests. This formula is used to calculate equity in valuation and investment analysis.
Equity Value ≠ Market Cap: use Treasury Stock Method (TSM) for options and warrants, and if-converted treatment for in-the-money convertibles to compute fully diluted shares. This precision matters in deal contexts where every share counts.
Enterprise Value vs Equity Value: Key Differences
The distinction between enterprise value vs equity value drives different analytical applications and investment decisions.
Scope: EV reflects operating assets for all capital providers and represents the overall value of the business; Equity reflects value to common shareholders. An equity investor cares about returns per share, while a strategic acquirer focuses on total business value.
Calculation: EV = Equity Value + net debt + preferred stock + non-controlling interests (± leases/other debt-like, − non-ops); Equity = price × fully diluted shares. The bridge reveals capital structure complexity and acquisition mechanics, as enterprise value includes both debt and other obligations, while equity value does not
Capital structure: EV remains neutral to financing decisions; Equity is sensitive to leverage. Two identical operating businesses with different debt levels have the same enterprise value but different equity values, because the financing structure—how much debt versus equity is used—affects equity value but not enterprise value.
Use cases: EV for comps, LBO models, and M&A analysis; Equity for shareholder metrics (P/E, P/B) and financial institution sectors. The application determines which metric provides more relevant insights.
Multiples: EV/EBITDA, EV/EBIT, EV/Sales vs P/E, P/B(TBV). Enterprise value multiples compare operational performance while equity multiples reflect shareholder-focused returns.
| Attribute | Enterprise Value | Equity Value |
|---|---|---|
| Scope | All capital providers | Common shareholders only |
| Debt Included | Yes (as net debt) | No |
| Cash Treatment | Subtracted | No direct impact |
| Preferred Stock | Added | Excluded |
| Primary Use | M&A, LBO, Comps | Shareholder analysis, P/E ratios |
| Capital Structure | Neutral | Sensitive to leverage |
5 EV Bridge Traps That Break Valuations
These aren’t theoretical — they show up in live deal models and comp sets regularly:
1. IFRS 16 Lease Double-Count
The trap: Adding operating lease liabilities to EV while also including lease expense in EBITDA. You’re capitalizing the liability but not removing the expense — double-counting.
The fix: If you add lease liabilities to EV, use EBITDAR (strip rent). If you keep lease expense in EBITDA, don’t add lease liabilities. Pick one treatment and be consistent.
2. Net Debt Sign Errors
The trap: Subtracting cash when you should be adding it (or vice versa). EV = equity value + net debt, where net debt = total debt – cash. Sign errors flip your EV by 2× the cash balance.
The fix: Write the formula explicitly. Check: is EV > equity value? (It should be if the company has net debt.) If EV < equity value, you probably have a sign error.
3. Noncontrolling Interest: Book vs Fair Value
The trap: Using the book value of NCI from the balance sheet instead of fair value. Book value can be wildly different from market value.
The fix: For public subsidiaries, use market cap of minority stake. For private, apply the same multiple as the parent. Never use book value without adjusting.
4. Treasury Stock Method Errors on Diluted Shares
The trap: Including all options/warrants in diluted share count without netting proceeds. Or using wrong exercise prices.
The fix: TSM: shares from exercise – shares bought back at current price = net dilution. Only include in-the-money options (exercise price < current share price).
5. Cash-Free Debt-Free (CFDF) Confusion
The trap: Assuming CFDF means the buyer gets all cash on the balance sheet. It doesn’t — excess cash goes to the seller. The buyer pays for the enterprise and the seller delivers it free of debt and excess cash.
The fix: Define ‘cash’ and ‘debt’ in the SPA. Restricted cash, customer deposits, and working capital cash are NOT ‘excess cash.’ The WC peg determines the cut.
EV Bridge Verification Checklist
Run this before submitting any comp set, valuation, or IC memo:
- EBITDA and lease treatment are consistent (no IFRS 16 double-count)
- Restricted cash excluded from cash offset (only unrestricted cash nets against debt)
- NCI valued at fair value, not book value
- Diluted shares calculated via TSM with correct exercise prices
- CFDF definition matches SPA terms (or stated assumptions if no deal)
- Equity value = EV – net debt – NCI – preferred (formula check)
- WC treatment specified: target, peg, or normalized
- Sensitivity run: ±0.5× on EBITDA multiple shows reasonable equity value range
Get Deal Flow Bullet — free, every Friday.
One email a week — real deal frameworks and technical breakdowns from a middle-market practitioner. No fluff.
Enterprise Value and Equity Value Formulas
The enterprise value formula comes in two standard expressions, both equally valid for different analytical contexts:
EV = Market Cap + Total Debt − Cash & Cash Equivalents + Preferred Stock + Non-controlling Interests (+ leases/other debt-like; − non-operating assets).
EV = Equity Value + Net Debt + Preferred Stock + Non-controlling Interests (+ leases/other debt-like; − non-ops).
Equity Value = Share Price × Fully Diluted Shares Outstanding.
Net Debt = Total Debt − Cash & Cash Equivalents (haircut restricted/trapped cash; classify short-term investments only if highly liquid & non-operating). Bank loans are included in total debt when calculating enterprise value.
Non-operating assets to strip from EV include excess cash, marketable securities, equity-method stakes, assets held for sale, surplus real estate, and surplus cash as an adjustment in the calculation. These assets don’t drive operational performance metrics like EBITDA.
When bridging enterprise value to equity value, adjustments such as working capital adjustments are made to account for deviations from normal working capital levels at deal completion.
Accepted EV formula set
- EV = market capitalization + total debt − cash & cash equivalents + preferred stock + NCI (+ lease liabilities + other debt-like) − non-operating assets
- EV = Equity Value + net debt + preferred stock + NCI (+ lease liabilities + other debt-like) − non-operating assets
- Equity Value = share price × fully diluted shares (TSM for options/warrants; if-converted for ITM convertibles)
- Net debt = interest-bearing debt (ST + LT, incl. finance lease liabilities & PIK) − (cash & cash equivalents)
Note: These forms are equivalent when applied consistently. Align the EV numerator with the EBITDA/EBIT denominator (especially for lease treatment).
Net debt nuances
- Include in debt: drawn revolvers and term loans, bonds/notes, finance/capital lease obligations, PIK accreted interest, securitizations/ABS where recourse exists.
- Exclude (operating liabilities): A/P, accrued expenses, deferred revenue (treat as debt-like only in deals if obligations remain), taxes payable (unless explicitly debt-like per SPA).
- Cash treatment: apply haircuts to restricted/trapped balances (repatriation taxes, escrow/collateral, capital controls). Consider a disclosed minimum operating cash as non-nettable for comparability.
- Short-term investments/marketable securities: net as cash only if highly liquid and not required for operations; otherwise treat as non-operating assets and subtract from EV.
- Overdrafts & cash pooling: interest-bearing callable overdrafts → include in debt; simple cash-management offsets → don’t double count.
- FIG caveat: for banks/insurers, “net debt” is not meaningful (balance sheet is financial inventory).
Non-operating assets and cash nuances
- Keep EV aligned with operating metrics. Subtract non-operating assets so the numerator (EV) matches operating denominators (EBITDA/EBIT). Common items:
- Excess cash not required for day-to-day operations
- Marketable securities held for investment purposes
- Equity-method investments/unconsolidated affiliates
- Assets held for sale/discontinued operations
- Surplus real estate not integral to the core business
- Restricted or “trapped” cash. Do not net at face value in net debt. Apply a documented haircut for constraints such as repatriation taxes, collateral/escrow requirements, or capital controls.
- Short-term investments/marketable securities. Count as “cash” only if they are highly liquid and not required for operations; otherwise treat as non-operating assets in the bridge.
- Non-operating assets: marketable securities, equity-method investments, assets held for sale, surplus real estate — subtract to keep EV aligned with operating denominators (EBITDA/EBIT).
- (Optional) Minimum operating cash. If management/footnotes disclose a true minimum cash needed to run the business, consider not subtracting that portion (keep treatment consistent across the comp set).
Debt-like items commonly included in EV
- Pensions & OPEB deficits: Include the net underfunded amount (PBO/OPEB obligation − plan assets). Long-dated, mandatory cash outflows → debt-like.
- Contingent consideration / earnouts: Add the fair value booked under acquisition accounting; represents probabilistic future payments to sellers.
- Asset retirement obligations (ARO): Include the present value of legally required closure/remediation costs (e.g., decommissioning).
- Tax Receivable Agreements (TRAs): Include the expected payments owed to pre-IPO owners from realized tax savings.
- Deferred taxes: Exclude in trading comps (often roll forward); analyze case-by-case in deals, especially asset sales/step-ups where realization is likely near-term.
- Deferred revenue: Exclude in trading comps; treat as debt-like in deals if the buyer must deliver goods/services without receiving new cash.
Implementation notes:
- Use the most current fair value/carrying value disclosed; avoid mixing book and market values within the same bridge.
- Don’t double-count: if you adjust EBITDA for an item’s expense impact, ensure the EV bridge reflects the corresponding balance-sheet claim only once.
Dilution & Share Count
TSM (options/warrants): net new shares = options − (proceeds / current price). Only in-the-money options create dilution under the treasury stock method.
Convertibles: ITM = equity via if-converted treatment (don’t also count as debt); OTM = debt with no dilution. The stock price determines whether conversion is economically rational.
Corporate actions: buybacks and issuances change equity value and cash balances but leave EV unchanged through the equity ↔ net debt offset. This relationship maintains enterprise value stability during capital allocation decisions.
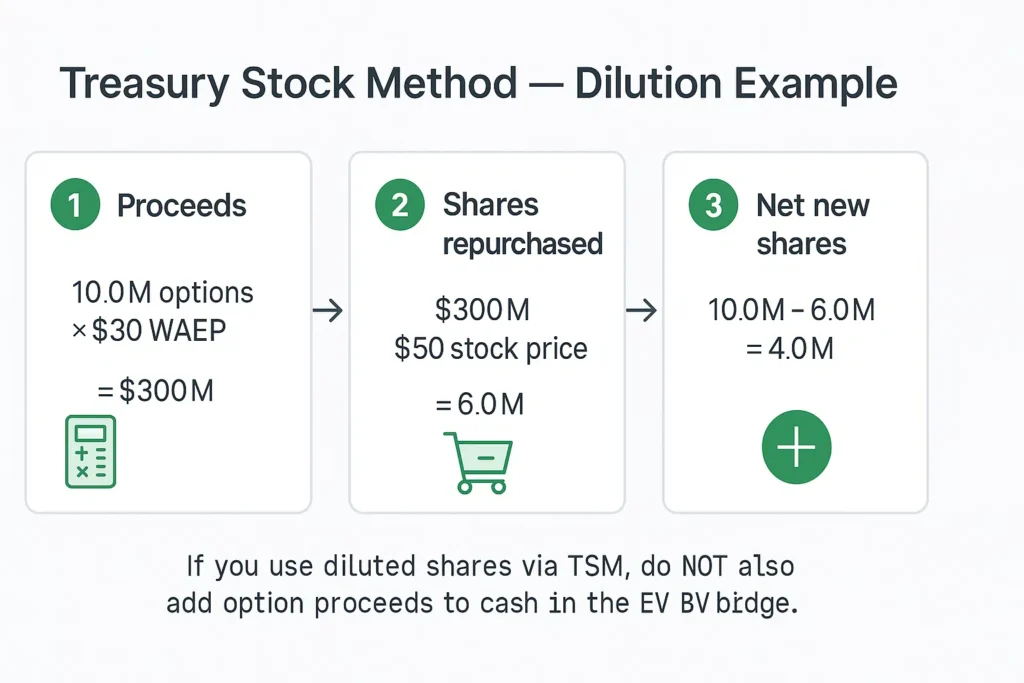
Dilution example (TSM) + anti–double-count guardrail
- Setup: Stock price $50; 10M in-the-money options with weighted-average exercise price (WAEP) $30.
- 1) Proceeds from exercise: 10,000,000 × $30 = $300,000,000.
- 2) Shares repurchased with proceeds: $300,000,000 ÷ $50 = 6,000,000 shares.
- 3) Net new (dilutive) shares: 10,000,000 − 6,000,000 = 4,000,000 shares.
- 4) Diluted shares outstanding: Basic shares + 4,000,000.
- 5) Diluted Equity Value: Diluted shares × $50.
Guardrail — don’t double count cash:
If you’ve used diluted shares via TSM to compute Equity Value, do not also add the option exercise proceeds to cash in the EV bridge. TSM already assumes those proceeds are used to repurchase shares; the cash doesn’t remain on the balance sheet.
Consolidation & affiliates
- Consolidated EBITDA ⇒ add NCI to EV. If your denominator includes 100% of a subsidiary’s EBITDA (parent owns >50%, consolidates), add the Non-Controlling Interest (NCI) to EV so the numerator reflects 100% ownership too.
- If EBITDA is not consolidated, don’t add NCI. When you’re using a parent-only or segment EBITDA that excludes the sub, leave NCI out of EV (or use a proportionate approach consistently on both sides).
- Equity-method affiliates / unconsolidated JVs (20–50%). Parent EBITDA excludes these by definition. Treat the investment as non-operating:
- Trading comps default: exclude affiliate/JV EBITDA from the denominator and subtract the carrying (or market) value of the investment from EV (double-exclusion).
- SOTP exception (rare in comps): if you include pro-rata EBITDA in the denominator, add a pro-rata EV for the affiliate in the numerator.
- Intercompany & proportion pitfalls. Ensure no double counting of affiliate income in EBITDA; check for intercompany eliminations and footnote disclosures that reclassify earnings below operating income.
- Measurement basis. Don’t mix market values for some items with book values for others within the same bridge. Pick a basis per comp set and stick to it.
- Quick checklist
- Are you using consolidated EBITDA? → Add NCI to EV.
- Any equity-method lines? → Exclude from EBITDA; subtract the investment from EV.
- Did you accidentally add NCI and use non-consolidated EBITDA? → Fix to avoid scope mismatch.
- Are affiliate cash flows material? Consider SOTP; otherwise stay with double-exclusion for clean comps.
| Item | In Equity Value? | In EV? | Why / Practitioner rationale |
|---|---|---|---|
| Common equity (fully diluted) | Yes | Yes (starting point) | Base claim for common holders; start EV bridge from diluted equity value. |
| Cash & cash equivalents | Yes | Subtract | Non-operating; reduces net purchase price (acquirer can use cash to repay debt). |
| Restricted / trapped cash | Yes | Subtract (haircut) | Not fully accessible (taxes, collateral, capital controls) → apply haircut, don’t net at face value. |
| Total debt (ST + LT, incl. PIK/finance leases) | No | Add | Senior financial claim on enterprise cash flows. |
| Convertible debt (in the money) | Yes (via if-converted shares) | Do not add as debt | Treat as equity to avoid double counting. |
| Convertible debt (out of the money) | No | Add as debt | Economic substance is debt; no dilution assumed. |
| Lease liabilities | No | Add only if EBITDA is lease-adjusted | Keep numerator/denominator consistent (IFRS 16 or normalized GAAP). |
| Preferred stock | No | Add | Senior to common; another class of capital provider. |
| Non-controlling interests (NCI) | No | Add | Align EV with 100% consolidated EBITDA. |
| Pension & OPEB deficits | No | Add | Long-dated, mandatory outflows → debt-like. |
| Contingent consideration / earnouts | No | Add (fair value) | Probabilistic but real claim recorded under acquisition accounting. |
| Asset retirement obligations (ARO) | No | Add | Legal, inevitable closure/remediation costs. |
| Deferred tax liabilities (DTL) | No | Exclude (trading comps) | Often roll; analyze case-by-case in deals/step-ups. |
| Deferred revenue | No | Exclude (trading comps) | Operating liability; treat debt-like in deals if obligations remain without new cash. |
| Unconsolidated affiliates / JVs (equity-method) | Yes | Subtract (asset) | EBITDA excludes affiliates — subtract the investment to keep the multiple clean (double-exclusion). |
| Options / RSUs / PSUs | Yes (via dilution) | Flows through starting equity | Capture via TSM/if-converted; don’t add as liabilities. |
| Tax Receivable Agreements (TRAs) | No | Add | Contractual payments on realized tax savings owed to legacy holders. |
Note: Keep a single valuation basis (book or market) within a given bridge, and disclose any haircuts/normalizations you apply.
Dilution & Share Count (TSM vs. If-Converted)
TSM (options/warrants)
- Use only in-the-money (ITM) instruments; out-of-the-money options are ignored for dilution.
- Weighted-average exercise price (WAEP): use WAEP across the ITM pool.
- 3 steps:
- Proceeds = ITM options × WAEP
- Shares repurchased = Proceeds ÷ current share price
- Net new shares = Options − shares repurchased
- RSUs/PSUs: typically add share-for-share (no proceeds), adjusted for expected forfeitures if disclosed.
If-Converted (convertible bonds/preferred)
- Binary rule: treat as either equity or debt—never both.
- In-the-money: add if-converted shares to the diluted count and do not include the instrument in debt for EV.
- Out-of-the-money: include the instrument as debt in EV; no share dilution.
- Coupon interest: if you’re modeling EPS dilution, remember after-tax coupon add-backs; for EV/dilution mechanics, keep the binary classification clean.
Dual-class & treasury shares
- Dual-class: include all outstanding classes in the diluted share count (voting differences don’t change equity value math).
- Treasury shares: exclude—they’re not outstanding.
- ESPP/other awards: add if clearly dilutive and exercisable/issuable per disclosures.
Corporate actions: why EV doesn’t change
- Buybacks: Equity Value ↓, Cash ↓ → Net Debt ↑ → EV unchanged.
- Primary issuance: Equity Value ↑, Cash ↑ → Net Debt ↓ → EV unchanged.
Quick numeric example (TSM)
- Setup: Stock = $50; ITM options = 10M at $30 WAEP.
- Proceeds: 10.0M × $30 = $300M
- Shares repurchased: $300M ÷ $50 = 6.0M
- Net new (dilutive) shares: 10.0M − 6.0M = 4.0M
- Diluted shares: Basic + 4.0M; Diluted Equity Value = Diluted shares × $50
Guardrail (no double count): If you used TSM to dilute shares, don’t also add option exercise proceeds to cash in the EV bridge—TSM assumes those proceeds buy back shares. See also: 5 Common LBO Modeling Traps (double-counts, lease mismatches, denominator drift).
ASC 842 and IFRS 16 Lease Accounting Impact
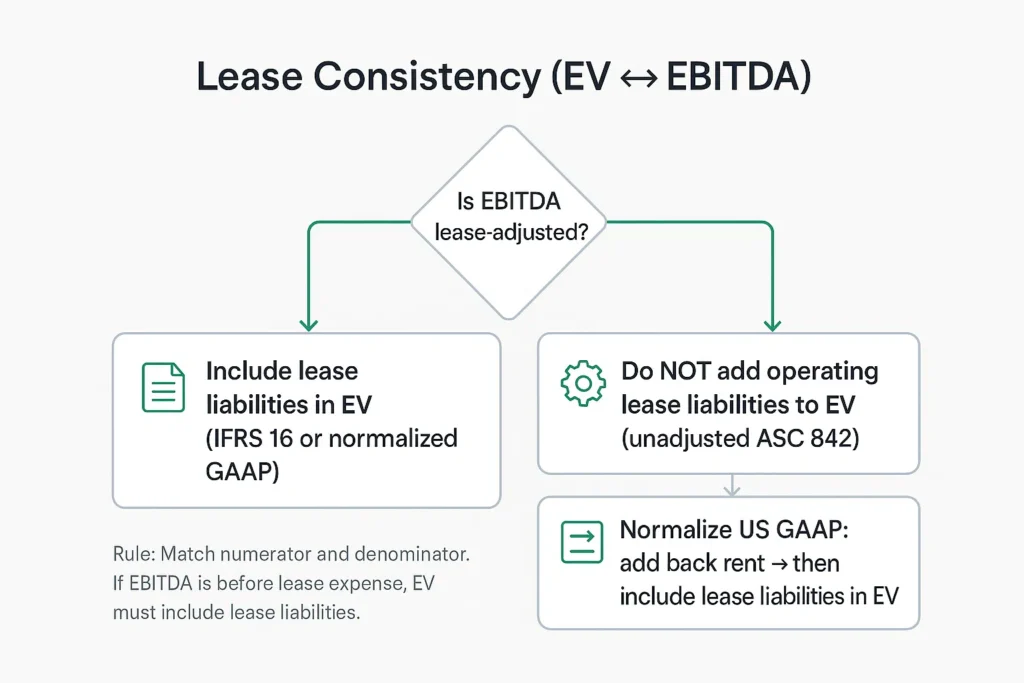
Lease accounting changes only matter for valuation if you keep numerator (EV) and denominator (EBITDA) on the same lease basis.
Consistency rule (numerator ↔ denominator)
- IFRS 16 reporters (lease-adjusted EBITDA): EBITDA excludes lease expense (recast into depreciation + interest) ⇒ include total lease liabilities (current + non-current) in EV. Finance lease obligations are already debt-like.
- ASC 842 (US GAAP), unadjusted EBITDA: Operating lease expense remains inside EBITDA ⇒ do not add operating lease liabilities to EV. Finance/capital lease obligations stay in debt.
- Normalized GAAP: If you add back rent to create lease-adjusted EBITDA, then also add operating lease liabilities to EV.
Mixed-peers normalization (IFRS vs US GAAP)
- Identify rent/operating lease expense in footnotes/MD&A.
- Add back rent to US GAAP EBITDA ⇒ lease-adjusted EBITDA.
- Add operating lease liabilities (current + non-current) to EV.
- Disclose the normalization and apply it consistently across the comp set and periods.
Lease-intensive sectors (retail, airlines, shipping)
- Use lease-adjusted multiples: EV (including lease liabilities) / EBITDA before rent.
- Keep IFRS and US GAAP peers on a common lease basis for historical and forward periods.
- If historical periods pre-date IFRS 16 (or liabilities aren’t disclosed), capitalize rent (e.g., 7–8× annual rent) or use disclosed PV of lease commitments—document the method and apply it uniformly.
- Avoid pitfalls: adding lease liabilities to EV while using unadjusted US GAAP EBITDA; mixing pre- and post-IFRS figures without normalization.
Equity Value for Private Companies
Private companies lack public market capitalization, requiring alternative approaches to determine equity value for investment and transaction purposes.
Intrinsic vs market approaches
- Unlevered DCF (UFCF @ WACC) → EV → bridge to Equity. Discount operating cash flows available to all capital providers; subtract net debt and other non-common claims to get Equity.
- Levered DCF (FCFE @ Cost of Equity) → Equity Value. Discount cash flows after interest and scheduled principal.
- Trading comps. Apply EV/EBITDA, EV/Sales from public peers to the private company’s metric → EV → bridge.
- Precedent transactions. Control-basis EV multiples from comparable deals (often include synergies/control).
- Funding rounds. Use post-money as a proxy with caution; adjust for share class waterfalls and recency.
Control & marketability adjustments
- Control premium: typically 20–40% when moving from minority trading comps to a control value.
- DLOC / DLOM: apply Discount for Lack of Control and Discount for Lack of Marketability when valuing minority, illiquid stakes.
- Don’t double-count control. Precedent transactions already embed control—avoid layering another premium.
- Document assumptions. State sources/ranges and keep treatments consistent across scenarios.
CFDF equity check (closing adjustments)
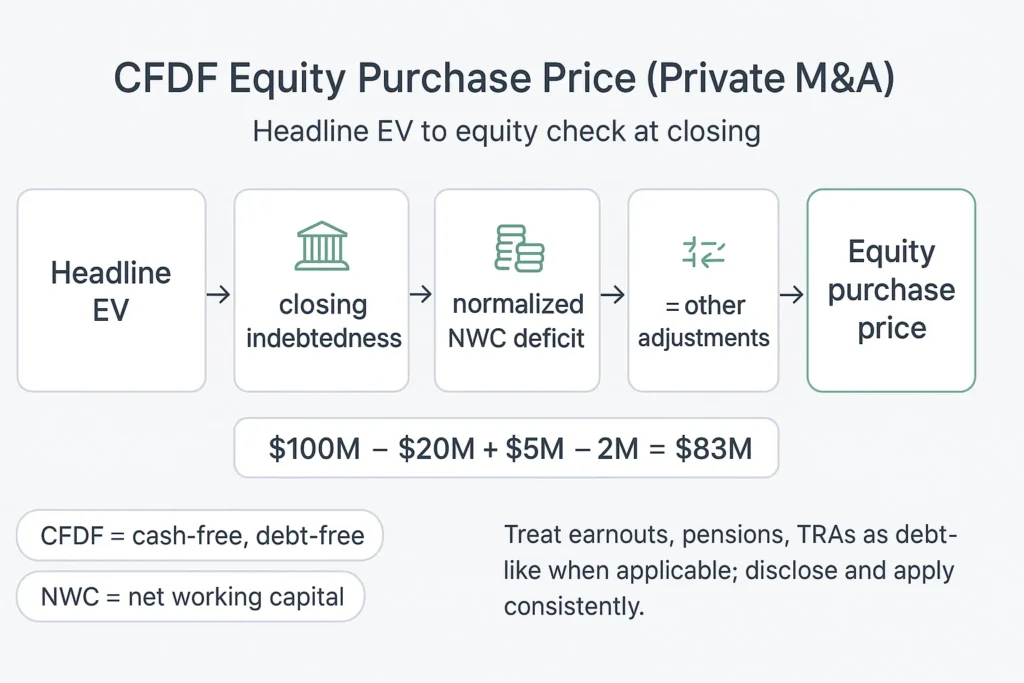
- Cash-free, debt-free (CFDF) headline EV is standard in private M&A.
- Equity purchase price at closing:
Equity purchase price = Headline EV − Closing Indebtedness + Closing Cash − Normalized NWC deficit ± Other adjustments - Components to define up front:
- Closing indebtedness: interest-bearing debt plus agreed debt-like items (e.g., finance leases, earnouts at fair value, pension/OPEB deficits, AROs, TRAs).
- Closing cash: cash & equivalents that transfer (exclude restricted/trapped by agreement).
- Normalized NWC target: dollar-for-dollar adjustment if delivered NWC is below/above target. Working capital deep dive:Net Operating Working Capital (NOWC) — definitions, examples, and common traps.
- Other adjustments: tax true-ups, customer prepayments to be serviced post-close, etc.
- Implementation notes: align SPA definitions with your EV bridge; build a balance-sheet roll-forward to closing; keep treatment consistent across the model and comps.
No market cap: derive equity value via levered DCF using free cash flow to equity discounted at the cost of equity, or derive EV via unlevered DCF using unlevered free cash flow discounted at WACC and bridge to equity value. Both approaches yield equivalent results when properly executed. In private company valuation, both levered free cash flow and unlevered free cash flows are used in DCF models to ensure consistency in calculating enterprise and equity value.
Market approaches: trading comps using EV/EBITDA and EV/Sales multiples, plus precedent transactions on a control basis. Public company multiples provide benchmarks but require adjustments for private company factors. In M&A transactions, the valuation of the target company is determined using these methods, with a focus on how enterprise value and equity value relate specifically to the target company during negotiations.
Funding rounds: recent post-money valuations serve as proxies but require adjustment for share class waterfalls and liquidation preferences. Preferred shares, which have priority in dividends and asset claims, can significantly impact common equity value in these scenarios.
Control & marketability: add control premium (≈20–40%) when moving from minority trading multiples to control value; apply discount for lack of control (DLOC) or discount for lack of marketability (DLOM) for minority/illiquidity when relevant. Transaction comps already embed control premiums.
Cash-free, debt-free close mechanics: equity purchase price = headline EV − closing indebtedness + closing cash − normalized net working capital deficit ± other adjustments. This structure isolates operational value from balance sheet fluctuations.
Private companies: control & marketability + CFDF equity check
- Valuation basis without a market cap
- Unlevered DCF (UFCF @ WACC) → EV → bridge to Equity.
- Levered DCF (FCFE @ Cost of Equity) → Equity Value.
- Market approaches: trading comps (EV/EBITDA, EV/Sales) and precedent transactions (control-basis multiples).
- Control vs. minority economics
- Control premium: typically 20–40% when moving from minority trading multiples to a control value.
- DLOC/DLOM: apply a Discount for Lack of Control and a Discount for Lack of Marketability when valuing minority, illiquid stakes.
- Precedent transactions usually embed control already—avoid layering a second control premium.
- Funding rounds as benchmarks
- Use post-money valuations with caution; adjust for share class waterfalls (preferred vs common) and liquidation preferences.
- Time-sensitivity matters: stale rounds may not reflect current risk/cash flow.
- Define debt-like items and minimum cash precisely in the SPA; align with what you include in the EV bridge.
- Build a roll-forward schedule from the latest balance sheet to closing to avoid surprises.
- Keep treatment consistent across comps, model, and legal definitions to prevent double-counts.
Worked Example: ABC Manufacturing Corp
Consider ABC Manufacturing Corp with the following market data and balance sheet information:
Price = $50; fully diluted shares = 100 million → Diluted Equity Value = $5.0 billion.
Balance sheet components:
- Total debt: $2.5 billion
- Cash & cash equivalents: $0.8 billion
- Preferred stock: $0.2 billion
- Non-controlling interests (NCI): $0.3 billion
Control & marketability adjustments
- Control premium: typically 20–40% when moving from minority trading comps to a control value.
- DLOC/DLOM: apply Discount for Lack of Control and Discount for Lack of Marketability when valuing minority, illiquid stakes.
- Don’t double-count control: precedent transactions already embed control—don’t add another premium.
- Document assumptions: state sources/ranges and keep treatments consistent across scenarios.
Calculate enterprise value: EV = $5.0B + $2.5B − $0.8B + $0.2B + $0.3B = $7.2B
When bridging from enterprise value (EV) to equity value, you deduct the company’s debt and add back cash to reflect the value attributable to shareholders. Enterprise value represents the value of the entire business, including both debt and equity holders, so subtracting the company’s debt and other non-equity claims isolates the portion belonging to equity holders.
Bridge back from EV to Equity to verify: Equity Value = $7.2B − $1.7B (net debt) − $0.2B (preferred) − $0.3B (non-controlling interests) = $5.0B ✓
Note: if TSM was used to compute dilution, do not also add option exercise proceeds to cash, avoiding double counting in the enterprise value calculation.
Mini-sensitivity: A $100 million increase in cash reduces EV to $7.1 billion, while $100 million in additional debt increases EV to $7.3 billion, demonstrating the direct net debt impact.
Want the end-to-end build? How to Build an LBO Model or compare against a real middle-market case: $150M Distribution LBO (step-by-step + model).
When to Use Enterprise Value vs Equity Value
The choice between enterprise value vs equity value depends on the analytical context and the questions being answered.
Use EV multiples (EV/Sales, EV/EBITDA, EV/EBIT) for operating comparisons across different capital structures. These multiples isolate operational performance from financing decisions, enabling clean peer group analysis.
Use equity multiples (P/E, P/B) for shareholder-focused analysis and financial institution (FIG) sectors where debt is a raw material rather than financing. Banks and insurance companies require equity-focused metrics due to their unique business models. In investment research, research analysts typically focus on equity value when evaluating stocks, as their primary concern is the value attributable to shareholders. For how these metrics show up across roles, see Investment Banking vs Private Equity.
In M&A transactions, headlines reference enterprise value as the total deal size, while the equity check equals EV adjusted for net debt and other claims. Sellers receive equity value; acquirers pay enterprise value net of assumed obligations. How sponsors actually create value post-deal: Private Equity Value-Creation Levers.
Sector notes: REITs and real estate companies prefer FFO/AFFO/NAV metrics; lease-heavy sectors need lease-adjusted multiples for comparability; holding companies often require sum-of-the-parts (SOTP) analysis to capture subsidiary values.
For a career-lens on where these multiples dominate, see Middle-Market PE Careers.
Do’s and Don’ts for Enterprise Value vs Equity Value
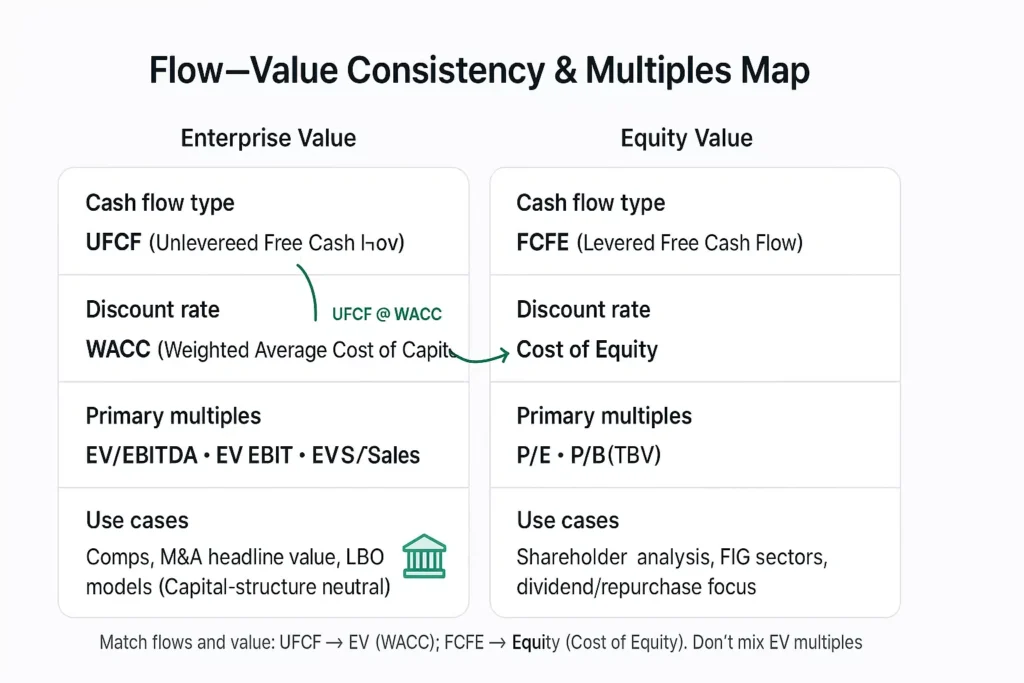
- DO match cash flows to value (unlevered free cash flow ↔ EV; free cash flow to equity ↔ Equity Value).
- DO include preferred stock, non-controlling interest, and debt-like items in EV; DON’T forget pensions, earnouts, or asset retirement obligations.
- DO compute fully diluted shares using TSM and if-converted methods; DON’T equate basic market cap with total equity value.
- DO maintain lease consistency between EBITDA and EV; DON’T include lease liabilities with unadjusted US GAAP EBITDA.
- DO use net debt (Total Debt − Cash), not gross debt; DON’T net trapped foreign cash at face value without considering repatriation costs.
- DO align consolidation by adding non-controlling interest when using consolidated EBITDA; DON’T mismatch numerator and denominator scope.
Sector exceptions (when EV multiples mislead)
Banks & Insurers (FIG)
- Interest expense is core COGS; net interest margin drives earnings → EV/EBITDA is not meaningful.
- Prefer P/E, P/B or P/Tangible BV, and dividend/earnings-based models (e.g., DDM).
- “Net debt” isn’t conceptually useful; the balance sheet is financial inventory.
REITs & real estate
- Heavy non-cash depreciation distorts EBITDA; assets appreciate over time.
- Prefer FFO/AFFO and NAV; use property-level cap rates for asset valuation.
- EV/EBITDA can be shown, but explain its limitations next to FFO/AFFO.
Lease-heavy operators (airlines, shipping, retail)
- Use lease-adjusted multiples: EV including lease liabilities / EBITDA before rent.
- Keep lease policy consistent across the comp set (IFRS vs US GAAP normalization).
Fintech hybrids
- Payments/platform businesses (processing, networks): EV/Revenue or EV/Gross Profit in early/high-growth phases; migrate to EV/EBITDA as margins mature.
- Lending-backed models: blend P/TBV (credit book) with EV/EBITDA (platform/services).
Holdcos & conglomerates
- Use SOTP (sum-of-the-parts): value each segment with its appropriate comps/method, minus corporate overhead, then adjust for corporate net debt and non-operating assets.
- Avoid a single blended multiple that masks segment economics.
Red-flags & QA checklist (avoid the classic traps)
Flow–value consistency
- UFCF ↔ EV; FCFE ↔ Equity. Don’t discount unlevered cash flows and then compare to Equity Value, or vice versa.
- Lease policy aligned. If EBITDA is lease-adjusted (IFRS 16 / normalized GAAP), include lease liabilities in EV. If EBITDA is unadjusted US GAAP, don’t.
Consolidation scope
- Consolidated EBITDA → add NCI to EV. If the denominator includes 100% of a sub’s EBITDA, the numerator must reflect 100% ownership.
- Equity-method affiliates/JVs. Exclude affiliate EBITDA and subtract the investment from EV (double-exclusion). Use SOTP only if you proportionately include both sides.
Dilution mechanics
- Equity Value ≠ basic market cap. Use fully diluted shares (TSM for options/warrants; if-converted for ITM convertibles).
- Convertibles binary rule. ITM → treat as equity (do not add as debt). OTM → treat as debt (no dilution).
- Anti–double-count. If you used TSM to dilute, don’t also add option proceeds to cash.
Net debt pitfalls
- Use Net Debt, not gross. Net Debt = Interest-bearing debt − (Cash & equivalents).
- Trapped/restricted cash. Apply a haircut (taxes/covenants/controls); don’t net at face value.
- Short-term investments/marketable securities. Count as “cash” only if highly liquid and truly non-operating.
EV bridge completeness
- Don’t forget debt-likes. Pensions/OPEB deficits, earnouts (fair value), AROs, TRAs.
- Deferred taxes & deferred revenue. Exclude in trading comps; assess case-by-case in deals (asset deals/step-ups; unearned obligations).
- Lease liabilities. Add only when EBITDA is lease-adjusted (or you normalized GAAP to IFRS-like).
Basis consistency
- Book vs market mixing. Avoid combining market values for some items with book values for others inside the same bridge. Pick a basis and stick to it across the comp set.
M&A CFDF execution
- Equity check at closing: Equity purchase price = Headline EV − Closing Indebtedness + Closing Cash − Normalized NWC deficit ± other adjustments.
- Define debt-likes & minimum cash in the SPA; align with what you include in the EV bridge.
- NWC target. Shortfall at close is a dollar-for-dollar price reduction.
Fast sanity checks
- Equation parity. Rebuild Equity from EV to confirm the bridge reconciles.
- Sensitivity. ±$100m cash → EV moves ∓$100m; ±$100m debt → EV moves ±$100m.
- Negative EV. Signals market expects operating value destruction—switch to liquidity/asset coverage analysis.
Frequently Asked Questions
EV is the value of the business to all capital providers (debt + equity). Equity Value is the portion left for common shareholders after debt, preferred stock, and other senior claims.
No. Market cap = share price × basic shares. Equity Value should use fully diluted shares (TSM for options/warrants; if-converted for in-the-money convertibles).
Cash is non-operating and can be extracted without harming operations, so it reduces the net cost to acquire the business. (If a true minimum operating cash level is disclosed, don’t subtract that portion for comps.)
Start from Equity Value, then add net debt, preferred stock, non-controlling interests (NCI), and other debt-like items (e.g., pensions/OPEB deficits, earnouts at fair value, AROs, TRAs). Subtract non-operating assets.
Yes—when your denominator uses consolidated EBITDA (includes 100% of a sub’s EBITDA). Don’t add NCI if you’re using parent-only or proportionate metrics.
Include only when EBITDA is lease-adjusted (IFRS 16, or US GAAP normalized by adding back rent). If EBITDA is unadjusted US GAAP (rent inside EBITDA), don’t add operating lease liabilities to EV.
Yes—when cash & equivalents > market cap + debt. It usually signals distress or market expectations of operating value destruction; analyze liquidity/asset coverage rather than standard multiples.
No. Buybacks: Equity ↓, Cash ↓ → Net debt ↑ → EV unchanged. Issuances: Equity ↑, Cash ↑ → Net debt ↓ → EV unchanged. EV tracks operations, not capital structure shuffles.
Use an unlevered DCF (UFCF @ WACC) to get EV and bridge to Equity, or apply EV/EBITDA / EV/Sales trading or transaction multiples. For Equity Value directly, a levered DCF (FCFE @ Cost of Equity) works. Apply control premiums and DLOC/DLOM as appropriate.
Exclude in trading comps (operating liability). In M&A, if the buyer must deliver without new cash, treat the shortfall as a debt-like equity-check adjustment.
Yes—when the company has net cash (negative net debt) and no other significant debt-like items; EV can be less than Equity Value by the amount of net cash.
Apply a haircut for repatriation taxes, collateral/escrow, or capital controls. Don’t net at face value in net debt, and keep the haircut assumption consistent across the comp set.
Related resources: Private Equity Interview Questions, Interview Strategy Guide, Networking Guide, Resume Template (Free), DPI explained, Break Into PE (No-Banking Roadmap), PE Salary 2026, MM PE Careers Guide, Off-Cycle Recruiting Timeline.
Glossary (concise one-liners)
- Enterprise Value (EV): Value of core operations available to all capital providers (debt + equity).
- Equity Value: Value attributable to common shareholders; use fully diluted shares (TSM + if-converted), not basic market cap.
- Net Debt: Interest-bearing debt − (cash & equivalents); apply haircuts to restricted/trapped cash.
- NCI (Non-Controlling Interest): Portion of a consolidated sub not owned by the parent; add to EV when using consolidated EBITDA.
- TSM (Treasury Stock Method): Options/warrants dilution: proceeds → shares repurchased → net new shares.
- If-Converted: Treat in-the-money convertibles as equity (add shares); don’t also count as debt.
- PIK Debt: Interest accrues to principal; include in EV as debt-like.
- OPEB: Other post-employment benefits; unfunded deficits are debt-like.
- PBO: Projected benefit obligation in defined-benefit pensions; compare to plan assets to find deficit.
- ARO: Asset retirement obligation (legal end-of-life costs); add to EV.
- TRA (Tax Receivable Agreement): Contractual payments of realized tax savings to legacy holders; add to EV.
- DTL (Deferred Tax Liability): Generally exclude in trading comps; analyze case-by-case in deals/step-ups.
- Deferred Revenue: Exclude in trading comps; treat debt-like in deals if obligations remain without new cash.
- CFDF: Cash-free, debt-free convention in private M&A headline EVs.
- SOTP: Sum-of-the-parts valuation for holdcos/conglomerates.
- IFRS 16 / ASC 842: Lease standards; apply the consistency principle across EV and EBITDA.
- Lease-adjusted EBITDA: EBITDA before rent (IFRS or normalized GAAP); requires adding lease liabilities to EV.
- FFO / AFFO: REIT cash-flow metrics; prefer over EBITDA; NAV is asset-based equity valuation.
- TBV: Tangible book value; common equity metric for banks/insurers.
- UFCF: Unlevered free cash flow → discount at WACC → EV.
- FCFE: Free cash flow to equity → discount at Cost of Equity → Equity Value.
- WACC: Weighted average cost of capital (blended debt + equity required return).
- DDM: Dividend discount model; core intrinsic approach for FIG.
References
Accounting standards & technical guidance
- FASB ASC 842 — Leases (U.S. GAAP)
- FASB ASC 805 — Business Combinations (purchase accounting; contingent consideration, fair value)
- FASB ASC 260 — Earnings per Share (TSM and if-converted mechanics)
- IASB IFRS 16 — Leases (lease capitalization; EBITDA effects)
- IASB IFRS 3 — Business Combinations (acquisition accounting)
- IAS 28 — Investments in Associates and Joint Ventures (equity-method logic)
Valuation & corporate finance texts
- Koller, Goedhart, Wessels. Valuation: Measuring and Managing the Value of Companies (McKinsey, latest ed.).
- Damodaran, Aswath. Investment Valuation (Wiley, latest ed.).
- Damodaran, Aswath. Damodaran on Valuation (Wiley, latest ed.).
- Petersen & Plenborg. Financial Statement Analysis (for non-operating asset treatment & consistency).
Practitioner manuals & deal mechanics
- PwC / Deloitte / EY / KPMG—business combinations and leases guidebooks (Big-4 manuals on ASC 805, ASC 842/IFRS 16).
- ABA Model Stock/Asset Purchase Agreements (CFDF conventions, working capital adjustments).
- CFA Institute—standards and handbooks on equity valuation and free cash flow definitions.
Practitioner primers & training (bridges, dilution, multiples)
- Wall Street Prep (WSP)—EV vs Equity Value bridges; lease adjustments; TSM walkthroughs.
- Macabacus—EV/Equity bridges; NCI and consolidation; equity-method & SOTP treatment.
- Corporate Finance Institute (CFI)—formula refreshers and examples of EV/EBITDA vs P/E.
Sector-specific references
- NAREIT—definitions of FFO/AFFO and REIT reporting conventions.
- Bank/Insurance regulatory sources—Basel materials, NAIC statements (for P/B, P/TBV context).
Real-world disclosure examples (for footnote hunting when needed)
- Recent 10-Ks / 20-Fs from IFRS and U.S. GAAP issuers with:
- Significant operating leases (IFRS 16 vs ASC 842 contrast)
- NCI and consolidated subs
- Equity-method affiliates
- Pension/OPEB deficits
- Contingent consideration/earnouts
- TRAs (common in tech/consumer IPOs and de-SPACs)
This article is educational and intended for informational purposes only; it should not be construed as investment advice.
Related Technical Guides
- How to Build an LBO Model — the 5-step guide these traps are designed to protect
- Net Operating Working Capital — the cash-conversion framework behind CFDF and working capital adjustments
- Private Equity Value Levers — how operational improvement, multiple expansion, and deleveraging actually drive returns
- Private Equity DPI — what realized cash returns look like when valuation discipline holds
- Middle Market Definition — the operating size band most U.S. lower- and core-MM comp sets sit inside
Stay sharp. Subscribe to Deal Flow Bullet.
Weekly PE frameworks, deal analysis, and career intel for middle-market practitioners. Free, every Friday.
- March 2026 — Added EV bridge traps, verification checklist, removed content duplication, added cross-links
- February 2026 — Updated examples and benchmarks to 2026
- September 2025 — Original publication