Every $1 reduction in net operating working capital (NOWC) generates $1 of immediate free cash flow without touching EBITDA. For middle-market private equity operators, this isn’t just a finance textbook concept… it’s the difference between covenant compliance and a difficult conversation with your lender. NOWC is a key indicator of a company’s short-term liquidity and ability to meet near-term obligations.
Working capital slippage is one of the most common precursors to covenant pressure in MM/LMM deals. As CCC lengthens, availability shrinks, net leverage ticks up even with flat EBITDA, and springing tests get tight. Yet most deal teams still treat working capital optimization as an afterthought, missing one of the fastest paths to value creation in their portfolio.
This guide breaks down net operating working capital (NOWC) into actionable levers that middle-market and lower-middle-market operators can pull to unlock cash, improve covenant headroom, and position portfolio companies for premium exits. NOWC provides a clearer indicator of a company’s ability to fund its day-to-day activities and operational needs.
NOWC Operator Blueprint (TL;DR)
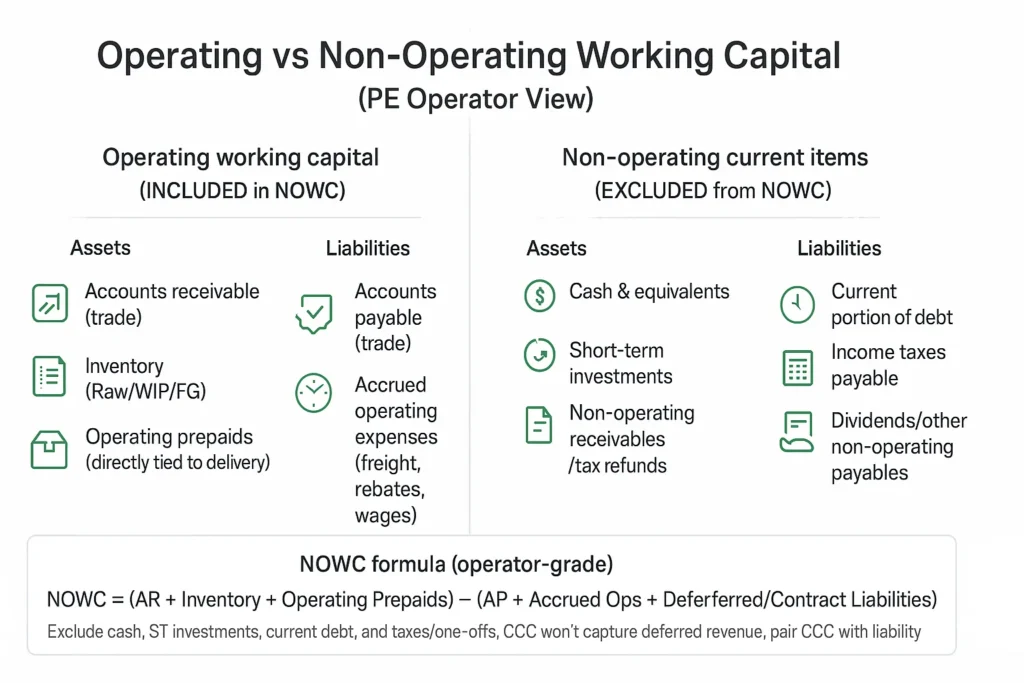
- Define the scope: Compute NOWC = (AR + Inventory + Operating Prepaids) − (AP + Accrued Ops + Deferred/Contract Liabilities). Exclude cash, short-term debt, taxes/one-offs.
- Baseline & targets: Measure NOWC % of sales and CCC (DSO + DIO − DPO). Set 90-day goals (e.g., DSO −8d, DIO −10d, DPO +7d) and an owner for each lever.
- Days → Dollars: Size impact with (Revenue ÷ 365) × ΔDSO and (COGS ÷ 365) × (ΔDIO or ΔDPO). Ex: $100M rev, −10 DSO ⇒ ≈ $2.74M cash.
- AR playbook (reduce DSO): Same-day e-invoicing, dunning cadence (Day 0/10/30/45), dispute codes, credit limits/insurance. 2/10 net 30 ≈ ~37% APR—only offer/take if your opportunity cost is lower.
- Inventory playbook (lower DIO): Service-level targets, SKU rationalization, reorder points & safety stock by variability, ABC cycle counts, slow/obsolete liquidation.
- AP playbook (extend DPO ethically): Standardize Net 45–60, weekly payment runs, 3-way match, dynamic discounting when cash-rich; protect supplier performance.
- Liquidity, covenants & value: Reconcile ΔNOWC to the 13-week cash model; monitor ABL eligibility/availability and springing FCCR. Treat ΔNOWC as a one-time level shift; capitalize only the recurring savings (interest/carrying cost) at exit.
TL;DR — Net Operating Working Capital for PE Practitioners
NOWC = Current Operating Assets – Current Operating Liabilities (exclude cash, debt, and non-operating items).
Why it matters in PE:
- ΔNWC is a direct cash flow line item — ignore it and your FCF is wrong
- WC normalization determines the peg in a CFDF transaction
- WC improvements are a real (often overlooked) value creation lever
Key formulas:
- Days Sales Outstanding (DSO) = (A/R ÷ Revenue) × 365
- Days Inventory Outstanding (DIO) = (Inventory ÷ COGS) × 365
- Days Payable Outstanding (DPO) = (A/P ÷ COGS) × 365
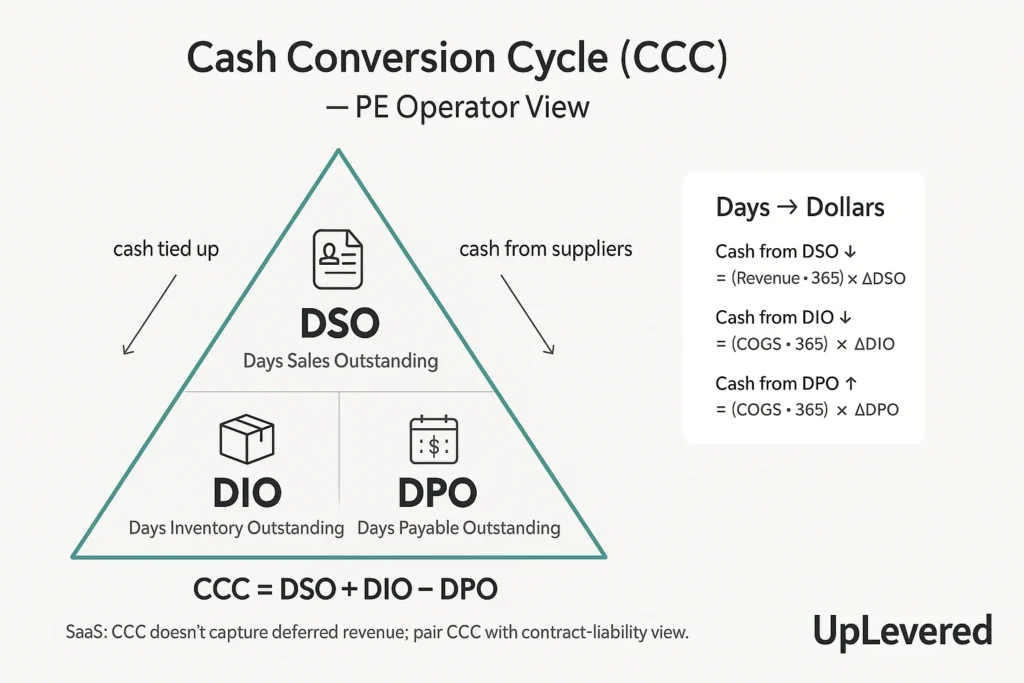
- Cash Conversion Cycle (CCC) = DSO + DIO – DPO
Lower CCC = less cash trapped in operations = more cash available for debt service and distributions.
Why NOWC Matters for Middle-Market Private Equity Deals
Net operating working capital, also sometimes just simplified to “net working capital” or “operating working capital (OWC)” in PE / IB, directly impacts free cash flow generation, affecting debt service capacity and covenant compliance in leveraged buyouts. Net operating working capital is also one of the key financial metrics used to evaluate a company’s liquidity, operational efficiency, and short-term financial position.
Working capital optimization can meaningfully improve free cash flow — the magnitude depends on starting efficiency, industry mix, and payment terms. This can be paired with other value-creation levers for additional operational improvements.
Exit multiples improve when buyers see sustainable cash conversion cycles and predictable working capital management.
Treat NOWC improvements as a balance-sheet level shift, not EBITDA. A $2M structural reduction lowers net debt by $2M immediately and trims interest by ~$160k/yr at 8%. If that saving is sustainable, buyers may capitalize it at their EBITDA multiple (10× → ~$1.6M). Total estimated value ≈ $3.6M, plus any second-order benefits from improved cash conversion (not directly multiplied).
Consider a $50M revenue manufacturing company reducing net operating working capital from 15% to 10% of sales—a $2.5M cash unlock. This improvement has multiple value creation effects:
- Immediate FCF boost: $2M available for debt paydown
- Interest savings: $2M released at 8% borrowing cost saves ~$160k annually
- Multiple expansion: Buyers pay premiums for predictable cash conversion
- Exit value: $160k annual savings at 10× EBITDA = $1.6M+ exit value gain
Improvements in NOWC can lead to stronger current cash flows, supporting both debt service and reinvestment, which are both critical components of leveraged buyouts.
The key distinction: tie cash unlocked to revolver headroom and interest savings. $2M released at 8% saves approximately $160k per year in financing costs.
Distinguish durable (process-driven) vs fragile (one-time stretch) improvements—only durable gains support higher multiples.
Buyers discount one-time working capital “pulls” but pay full multiples for sustainable process improvements. A company that reduces DSO from 45 to 35 days through better collections processes earns credit. A company that factors receivables to generate cash at close does not.
Note seasonality: use a 13-week cash flow view to avoid mistaking timing shifts for structural improvement.
Holiday retailers naturally build inventory in Q3 and convert to cash in Q1. Manufacturing companies with construction exposure follow similar patterns. Track net operating working capital on a trailing twelve-month basis to separate seasonal timing from operational improvement.
NOWC Definition and Formula for PE Operators
Formula: Net Operating Working Capital (NOWC)
Definition (operator-grade):
NOWC = Operating Current Assets − Operating Current Liabilities
(Exclude cash & equivalents, short-term investments, short-term debt, and taxes/one-offs.)\
Also referred to as Operating Working Capital (OWC), Trade Working Capital (TWC), or Non-Cash Working Capital in some sources.
Expanded formula (usual examples of what’s include):
NOWC = (Accounts Receivable + Inventory + Operating Prepaids) − (Accounts Payable + Accrued Operating Expenses + Deferred/Contract Liabilities)
How to calculate (step-by-step)
- Pull operating current assets: trade AR, Inventory (Raw/WIP/FG), and Operating Prepaids that directly support revenue delivery (e.g., committed hosting, vendor deposits).
- Pull operating current liabilities: AP (trade), Accrued operating costs (freight, rebates, wages), and Deferred/Contract Liabilities from upfront billing or deposits.
- Exclude non-operating/financing items: cash & equivalents, marketable securities, current portion of debt, income taxes payable, dividends/payables unrelated to operations.
- Compute NOWC and express it both in dollars and as % of sales; track over time alongside the Cash Conversion Cycle (CCC = DSO + DIO − DPO).
Balance Sheet Mapping (Include/Exclude)
| Balance Sheet Caption | Include in NOWC? | Notes |
|---|---|---|
| Cash & Equivalents | No | Financing item; exclude. |
| Short-Term Investments | No | Not tied directly to core operations. |
| Accounts Receivable (Trade) | Yes | Include net of allowances. |
| Inventory (Raw/WIP/FG) | Yes | Track slow/obsolete separately. |
| Prepaid Expenses (operational) | Yes | Include only if tied to operations/revenue. |
| Other Receivables (non-trade) | Usually No | Include only if clearly operational and material. |
| Accounts Payable (Trade) | Yes | Exclude taxes/payroll if non-operating. |
| Accrued Expenses (operational) | Yes | Accrued COGS, freight, rebates, wages, etc. |
| Deferred/Contract Liabilities | Yes | Customer float from upfront billing/deposits. |
| Current Portion of Debt | No | Financing item; exclude. |
| Income Taxes Payable | No | Non-operating for NOWC. |
Note on prepaids: Some lender/SPA definitions exclude prepaid expenses from the working-capital peg. For operator analysis, include only operational prepaids; exclude taxes/one-offs.
Negative NOWC: Healthy vs. Fragile
Negative NOWC occurs when operating current liabilities exceed operating current assets. That’s not inherently bad:
Clarity: Negative working capital comes from customer float (deferred revenue, deposits) and supplier stretch (longer payables); the former is durable when retention/delivery are strong, the latter is fragile and often reverses in downturns as vendors tighten terms.
- Healthy negative NOWC (customer float):
- SaaS/maintenance: annual upfront billing → deferred revenue funds delivery.
- Services with deposits/milestones: cash in ahead of cost curves.
- Healthy negative NOWC (supplier float):
- Retail/grocery/marketplaces: fast inventory turns + Net 60+ supplier terms.
- Fragile negative NOWC (stretch):
- Extending DPO beyond sustainable levels, triggering vendor strain, supply risk, and sudden reversals in downturns.
Anchor diagnostics & quick benchmarks
- NOWC as % of revenue (directional ranges vary by model/mix):
- Manufacturing: ~12–18%
- Distribution: ~15–25%
- Services: ~5–10%
- SaaS: often negative due to deferred revenue
- CCC (DSO + DIO − DPO): use alongside NOWC % sales. CCC won’t capture deferred revenue, so pair it with the liability view in models that bill upfront.
Understanding Current Operating Liabilities
Current operating liabilities—accounts payable (AP), accrued operating expenses, and deferred/contract liabilities—are the moving parts that determine Net Operating Working Capital (NOWC) and near-term liquidity. Managed well, they fund the business at low (or zero) cost. Managed poorly, they drain availability, push up revolver usage, and tighten covenant headroom.
Accounts Payable (trade)
AP reflects what you owe suppliers for goods/services already received. The goal is to optimize liquidity without eroding supply reliability or pricing power.
- What it is: Payables on invoices for materials, freight, subcontractors, etc., tied to operations.
- Why it matters: Extending DPO (Days Payable Outstanding) increases supplier float and lowers net working capital.
- How to manage well:
- Standardize Net 45–60 on strategic spend; avoid “due on receipt.”
- Weekly payment runs only; block ad-hoc early pays.
- Enforce 3-way match (PO–receipt–invoice) to prevent duplicates/overpays.
- Use dynamic discounting only when your opportunity cost is below the discount’s implied APR (e.g., 2/10, net 30 ≈ ~37% APR).
- Track vendor on-time performance and dispute cycle time; protect relationships you depend on.
Accrued Operating Expenses
Accruals capture costs incurred but not yet invoiced—wages, bonuses, freight, rebates, warranty, utilities, and other operating items.
- What it is: Timing bridge between P&L and cash; accruals reverse to cash when invoices arrive or obligations settle.
- Why it matters: Poor accrual hygiene creates “surprise” cash outs when balances unwind.
- How to manage well:
- Maintain a monthly accrual schedule with owners, assumptions, and variance thresholds (investigate >10%).
- Tie accrual true-ups to P&L lines (e.g., COGS freight, sales rebates) for clean operating cash flow (OCF) reconciliation.
- Forecast cash timing in the 13-week model (payroll cycles, bonus timing, freight seasonality).
Deferred Revenue / Contract Liabilities
Deferred revenue arises when you collect cash before delivering (subscriptions, maintenance, deposits, milestone billing).
- What it is: Operational obligation to deliver future service/product; economically, customer float.
- Why it matters: Creates negative working capital that can be very healthy (interest-free financing) if delivery/retention are strong.
- How to manage well:
- Align delivery capacity and support SLAs with billing terms to avoid refunds/chargebacks.
- Monitor NRR/GRR, refund rates, and backlog burn-down; durable float comes from durable customers.
- Debt nuance: ABL availability won’t rise with deferred revenue (you already have the cash); keep AR/inventory eligible to protect liquidity.
Management principles (operator playbook)
- Treat liabilities as designed float, not a whack-a-mole of bills. Extend DPO ethically, accrue accurately, and convert customer prepay into reliable delivery.
- Run a weekly Cash War Room: AP pay run review, AR collections list, accrual/variance check, inventory exceptions.
- Optimize timing, not just totals: match AP runs, accrual reversals, and delivery schedules to CCC targets and covenant tests.
KPIs & cadence
- AP: DPO, % paid early (target ≈ 0), duplicate/late fees (target = 0), vendor on-time and dispute cycle time.
- Accruals: Variance vs prior month and vs P&L (thresholds and owner sign-off), scheduled cash conversion dates.
- Deferred/contract liabilities: Deferred revenue balance vs delivery capacity, NRR/GRR, refund/credit rate, backlog burn-down.
- Cash & covenants link: Track effects on availability, revolver balance, and FCCR each month; reconcile to the 13-week cash flow so seasonality doesn’t masquerade as improvement.
Bottom line: disciplined oversight of operating liabilities is how you “play the float” without breaking the machine—supporting free cash flow, preserving ABL headroom, and de-risking covenants. Negative working capital can be a superpower when it’s customer-float-driven and operationally delivered; it’s fragile when it comes from supplier stretch with no process behind it.
NOWC Impact on Free Cash Flow and Deal Metrics
Every $1 reduction in NOWC generates $1 of immediate FCF without affecting EBITDA.
Working capital changes flow through OCF (operating cash flow), directly impacting debt paydown capacity.
NOWC-to-revenue ratios above sector benchmarks signal cash conversion inefficiencies.
Days → Dollars formulas (use prominently):
- AR: ΔCash ≈ (Revenue ÷ 365) × ΔDSO
- Inventory: ΔCash ≈ (COGS ÷ 365) × ΔDIO
- AP: ΔCash ≈ (COGS ÷ 365) × |ΔDPO|
These formulas convert operational improvements into immediate cash impact. For a $75M revenue company with $50M COGS:
- Reducing DSO by 5 days: ($75M ÷ 365) × 5 = $1.03M cash
- Reducing inventory days by 8: ($50M ÷ 365) × 8 = $1.10M cash
- Extending payables by 10 days: ($50M ÷ 365) × 10 = $1.37M cash
Covenants: Better CCC improves quarter-end net leverage and FCCR cushion.
Most middle-market credit agreements include minimum FCCR (Fixed Charge Coverage Ratio) and maximum net leverage covenants. Improving the cash conversion cycle provides cushion in two ways:
- Lower net debt: Cash freed from working capital pays down revolver
- Higher EBITDA: Reduced carrying costs (interest, storage, obsolescence) flow to earnings
ABL nuance: Cleaner AR/Inventory increases availability; deferred revenue doesn’t (cash already received).
Asset-based lending facilities advance against eligible accounts receivable and inventory. Net operating working capital improvements that clean up aged receivables or obsolete inventory directly increase borrowing capacity. However, deferred revenue doesn’t create ABL availability since the cash has already been collected.
The Three NOWC Optimization Levers
Accounts Receivable Management
DSO reduction via automated e-invoicing, strict term enforcement, and collections acceleration.
AR aging targets: 0–30 days ≥ 80%, 31–60 days ≈ 15%, 60+ days < 5%.
Credit policy tightening; factoring where appropriate for immediate cash conversion.
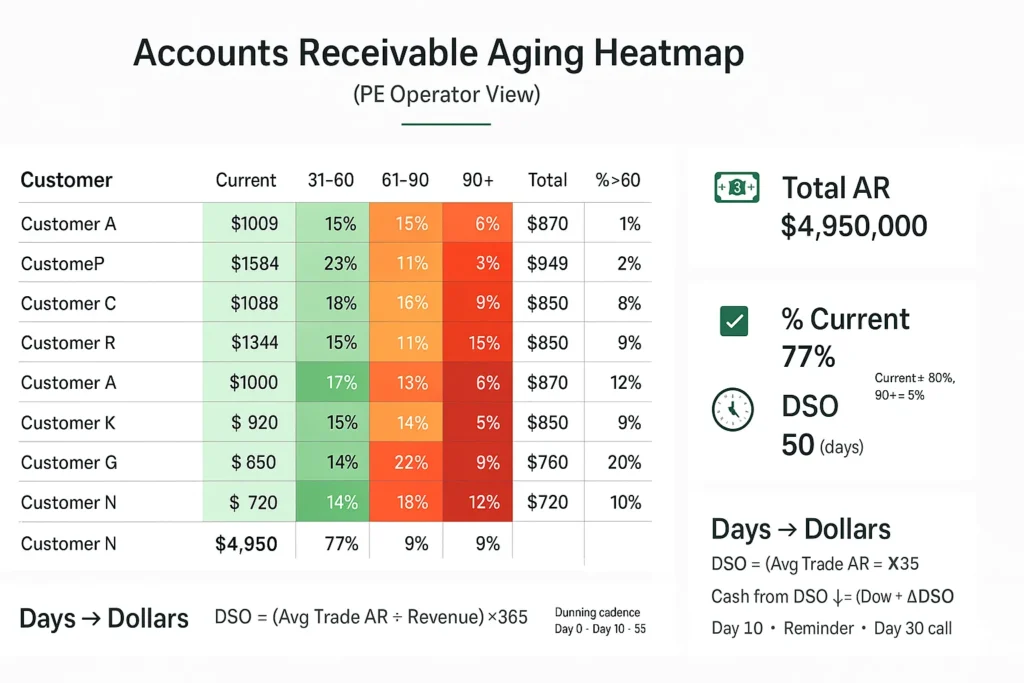
Dunning cadence: Day 0 e-invoice → Day 10 reminder → Day 30 call → Day 45 credit hold.
Automated collections processes eliminate the “forgot to follow up” excuse. Most ERP systems can automate this sequence:
- Day 0: Electronic invoice with payment portal link
- Day 10: Automated email reminder with payment link
- Day 30: Personal phone call from AR specialist
- Day 45: Credit hold and escalation to sales team
Discount math: 2/10, net 30 APR ≈ (0.02/0.98) × (365/20) ≈ 37%; only offer/take if cost of cash < 37%.
Early payment discounts sound attractive but are expensive financing. A 2% discount for paying 20 days early equates to 37% annual interest. Only extend these terms if your cost of capital exceeds 37%, or if you need the cash more than the profit margin.
Prevent disputes at source: PO match, shipment confirmation, required invoice fields (PO, tax, line-level detail).
The best collections strategy is preventing disputes from occurring. Implement these controls:
- Match invoices to purchase orders before shipping
- Require delivery confirmation signatures
- Include all required fields: PO number, tax details, line-item descriptions
- Send invoices within 24 hours of shipment
Concentration risk: consider credit insurance for top exposures.
If any single customer represents more than 10% of accounts receivable, evaluate credit insurance. The premium cost (typically 0.1-0.5% of insured receivables) is cheaper than the cash flow disruption from a bad debt write-off.
Inventory Optimization
DIO reduction through SKU rationalization, demand forecasting, and VMI where appropriate.
Just-in-time with safety stock tuned to demand/lead-time variability.
Obsolete inventory write-offs and structured liquidation for immediate cash release.
Include: inventory turnover analysis framework and cash impact calculator.
Guardrails: Service level (OTIF) first, turns second—don’t starve revenue.
The cardinal rule of inventory optimization: never sacrifice on-time, in-full delivery for working capital gains. Monitor these KPIs weekly:
- OTIF percentage (target: 95%+)
- Stockout frequency
- Customer complaints related to availability
- Lost sales due to inventory shortages
Tactics: ABC cycle counts, kill MOQs that bloat WIP, shorten supplier lead times.
Practical inventory management tactics:
- ABC analysis: Count high-value items monthly, medium-value quarterly, low-value annually
- MOQ elimination: Negotiate smaller minimum order quantities with suppliers
- Lead time reduction: Work with suppliers to reduce order-to-delivery cycles
- Demand sensing: Use point-of-sale data to improve forecasting accuracy
Commercial clean-up: bundles/markdown calendar to clear S/O/D stock without destroying price architecture.
Liquidate slow/obsolete/damaged inventory strategically:
- Bundle slow movers with fast-moving products
- Create seasonal markdown calendars
- Sell through secondary channels to avoid brand damage
- Consider liquidation companies for write-off inventory
Accounts Payable Extension
DPO extension via supplier term renegotiation and disciplined discount analysis.
Vendor financing / supply chain finance for win-win liquidity.
Payment timing optimization while protecting supplier relationships.
Most suppliers will negotiate payment terms if approached professionally. Use this script framework:
“We’re standardizing our payment terms to Net 45 for strategic suppliers. This change helps us invest more in growth initiatives that benefit our partnership. Can we discuss how to make this work for both companies?”
Controls: Weekly payment runs only; no ad-hoc early pays.
Discipline prevents payment term leakage:
- Establish weekly payment runs (e.g., every Tuesday)
- Require VP approval for any early payments
- Track DPO monthly and investigate variances
- Block ad-hoc payment requests from operations
Ethical extension: standardize Net 45–60 on strategic spend; maintain on-time performance.
Extend payment terms ethically:
- Target Net 45-60 for large suppliers who can absorb the change
- Maintain 100% on-time payment performance within new terms
- Pay small suppliers (sub-$10K annual spend) on current terms
- Never extend terms retroactively without supplier agreement
Dynamic discounting: toggle on when cash-rich; otherwise ride terms.
Some suppliers offer dynamic discounting programs where discount rates vary based on payment timing. Take these discounts when your cost of capital is low; ride full terms when you need the cash.
Get Deal Flow Bullet — free, every Friday.
One email a week — real deal frameworks and technical breakdowns from a middle-market practitioner. No fluff.
Cash Conversion Cycle (CCC) Optimization Framework
Formula: CCC = DSO + DIO − DPO; target 10–30 day reduction in first 12 months post-acquisition.
Visualization: CCC triangle diagram (receivables ↔ inventory ↔ payables).
Industry benchmarking: manufacturing, distribution, services (add SaaS/maintenance and retail/grocery for negative-WC archetypes).
Industry Cash Conversion Cycle Benchmarks:
| Industry | Typical CCC | Best-in-Class |
|---|---|---|
| Manufacturing | 60-90 days | 30-45 days |
| Distribution | 45-75 days | 20-35 days |
| Services | 30-60 days | 15-30 days |
| SaaS | -30 to +15 days | -60 to -30 days |
| Retail/Grocery | 15-45 days | -10 to +15 days |
SaaS note: CCC can appear negative when AR is minimal and inventory is nil, but CCC does not capture deferred revenue; the primary float sits in contract liabilities, so evaluate NOWC and customer float alongside CCC.
Owner targets: set explicit days goals per lever (e.g., DSO −8, DIO −10, DPO +7).
Establish specific improvement targets for each component:
- DSO target: Reduce by 8 days (focus on collections automation)
- DIO target: Reduce by 10 days (focus on demand forecasting)
- DPO target: Extend by 7 days (focus on supplier negotiations)
- Net CCC improvement: 25 days total
Link CCC wins to interest saved and ABL availability gained.
Quantify the financial impact of cash conversion cycle improvements:
- Interest savings: Days improved × (Revenue or COGS ÷ 365) × borrowing rate
- ABL availability: Eligible AR/inventory increases × advance rate
- Covenant cushion: Lower net debt improves leverage ratios
Numeric Mini-Case Studies
Case 1: Manufacturing Company NOWC Optimization
Profile: $75M revenue manufacturer; 18% NOWC-to-sales ($13.5M tied up).
90-day plan: DSO 45 → 35, turns 6× → 8×, DPO 25 → 35.
Cash impact: $2.1M (DSO) + $1.9M (inventory) + $1.5M (AP) = $5.5M total.
Result: NOWC-to-sales 10.7%, $5.5M debt paydown, improved covenant headroom.
Detailed calculation:
- DSO improvement: ($75M ÷ 365) × 10 days = $2.05M
- Inventory improvement: Assume $50M COGS, turns from 6× to 8× reduces inventory by ~$2.1M
- DPO improvement: ($50M ÷ 365) × 10 days = $1.37M
- Total cash generated: $5.52M
Note one-off vs run-rate: the $5.5M is a level shift in cash; interest savings recur.
The $5.5M represents a one-time cash generation. However, the annual interest savings of $440K (at 8% cost of debt) recur every year, making this a permanent improvement to free cash flow.
Level-shift vs. recurring value: Working-capital improvements create a one-time cash level shift (ΔNOWC). The recurring value comes from lower interest expense, lower carrying costs, and higher availability—that recurring savings may warrant a multiple, the level shift itself does not.\
Rule of thumb: Equity impact ≈ ΔNOWC + (EBITDA multiple × recurring savings).
Case 2: Distribution Business Working Capital Transformation
Profile: $40M revenue distributor; −5% EBITDA margins due to WC inefficiencies.
Program: automated AR collections; SKU −40%; vendor term extension.
Impact: $3.2M cash generated; +200 bps EBITDA via lower carrying costs.
Exit: sustainable 12% EBITDA; predictable cash supports 6.5× exit vs 4.0× distressed baseline.
Transformation details:
- Before: $40M revenue, -$2M EBITDA, $8M NOWC (20% of sales)
- AR automation: Reduced DSO from 50 to 35 days = $1.6M cash
- SKU rationalization: 40% SKU reduction freed $1.2M inventory
- AP extension: Net 30 to Net 45 = $0.4M cash
- After: $40M revenue, +$4.8M EBITDA (12%), $4.8M NOWC (12% of sales)
Show revolver paydown path and interest savings; protect OTIF to avoid revenue leakage.
The company used $3.2M cash to pay down its revolver, saving $256K annually in interest. Crucially, they maintained 96% OTIF performance throughout the inventory reduction, preventing revenue loss.
Case 3: SaaS Negative Working Capital (Customer Float)
Profile: $50M ARR; 60% annual upfront, 40% monthly.
Weighted unearned months: 0.6×6 + 0.4×0.5 = 3.8.
Deferred revenue (float): ≈ ARR × (3.8/12) ≈ $15.8M.
Implications: funds growth without external financing; lender comfort rises with strong NRR/GRR and low refunds.
SaaS working capital mechanics:
- Annual contracts: $30M ARR collected upfront = 6 months deferred revenue
- Monthly contracts: $20M ARR collected monthly = 0.5 months deferred revenue
- Blended: 3.8 months of deferred revenue = $15.8M cash float
This negative working capital model provides $15.8M of interest-free financing to fund growth. Lenders view this positively when supported by strong net revenue retention (95%+) and low refund rates (<2%).
NOWC Monitoring and Covenant Management
Monthly NOWC tracking with variance analysis and root-cause dives for covenant compliance.
Working capital facilities: size and utilization optimization for seasonality.
Management reporting: KPI dashboards for portfolio monitoring.
Include: covenant calculation examples and early-warning indicators.
Seasonality discipline: Track NOWC % of sales and CCC on a TTM basis, and reconcile to the 13-week cash model so quarter-end timing and calendar quirks don’t masquerade as improvement.
Create monthly variance reports that explain changes in each component:
- DSO bridge: Volume vs. collection timing vs. customer mix
- DIO bridge: Sales volume vs. purchasing timing vs. obsolete reserves
- DPO bridge: Purchase volume vs. payment timing vs. supplier mix
Watch springing FCCR and minimum liquidity triggers; CCC gains create cushion.
Many credit agreements include “springing” covenants that activate when availability falls below certain thresholds. Cash conversion cycle improvements provide cushion by:
- Increasing ABL availability (cleaner AR/inventory)
- Reducing revolver usage (more cash on hand)
- Improving FCCR through lower interest expense
ABL eligibility hygiene: manage ineligibles (aged AR, foreign caps, consignment) that quietly shrink availability.
Monitor these common eligibility killers:
- Aged receivables: >90 days typically become ineligible
- Foreign receivables: Often capped at 10-25% of borrowing base
- Consignment inventory: Usually ineligible for advances
- Related party receivables: Always ineligible
Exit Readiness and Value Creation
Buyer diligence prep: normalized working capital and forward-looking requirement analyses.
Working capital peg: establishment and true-up mechanisms in purchase agreements.
QoE impact: separate sustainable vs one-time WC improvements.
Working Capital Peg (What’s In/Out — Example)
| Item | Peg Treatment | Notes |
|---|---|---|
| Trade AR (eligible) | In | Normalized for bad debt |
| Inventory (net of reserves) | In | Exclude consignment |
| Trade AP | In | Operational only |
| Deferred Revenue | Often Out | Address via price adj./service cost true-up |
| Cash/Short-Term Debt | Out | Financing items |
| Taxes/One-offs | Out | Non-operating |
Working capital pegs vary by deal, but follow these principles:
- Include only operational working capital components
- Exclude financing items (cash, debt, marketable securities)
- Address deferred revenue through price adjustments or service cost true-ups
- Normalize for seasonal patterns using trailing twelve months
Prove durability: 4+ quarters of CCC improvement with SLA metrics (AR dispute rate, OTIF, vendor on-time).
Buyers pay premiums for proven, sustainable improvements. Document durability with:
- 16+ months of improvement: Shows sustainability through seasonality
- Service level maintenance: OTIF >95%, vendor on-time >98%
- Process documentation: Standard operating procedures for each lever
- Management continuity: Retain team members who drove improvement
Include customer/vendor letters confirming updated terms.
Obtain written confirmations of:
- Customer acceptance of updated payment terms
- Supplier acknowledgment of extended payment terms
- Service level agreements with key partners
- Credit limits and payment terms with major customers
Remember, buyers capitalize recurring savings (interest/carrying-cost/availability effects), not the one-time ΔNOWC level shift.
Implementation Roadmap for PE Portfolio Companies
100-day plan: baseline assessment, quick wins, management alignment.
Months 4–12: systematic process improvements, tech implementation, vendor negotiations.
Year 2+: continuous optimization and prep for next financing or exit.
Days 1-30: Assessment and Quick Wins
- Baseline working capital analysis and benchmarking
- Identify immediate collection opportunities (aged AR >60 days)
- Implement weekly cash flow forecasting
- Establish monthly covenant monitoring
Days 31-100: Process Implementation
- Deploy automated invoicing and collections
- Begin supplier term negotiations
- Implement inventory ABC analysis
- Create working capital dashboard
Stand up a weekly Cash War Room: AR call list, AP pay run, inventory exceptions.
Weekly cash war room agenda:
- Review aged AR call list and collection results
- Approve weekly AP payment run
- Address inventory exceptions (stockouts, excess, obsolete)
- Update 13-week cash flow forecast
- Monitor covenant metrics and ABL availability
Ship a Days → Dollars calculator and CCC dashboard (owner, target, variance).
Provide management with tools to track progress:
- Days → Dollars calculator: Convert operational metrics to cash impact
- CCC dashboard: Track DSO, DIO, DPO vs. targets
- Variance reporting: Explain monthly changes with root cause analysis
- ROI tracking: Measure improvement against investment in processes/technology
Align incentives: comp plans that reward cash conversion, not just shipped revenue.
Modify management incentive plans to include:
- DSO targets for sales leadership
- Inventory turn targets for operations
- Cash conversion metrics for operating cash flow
- NOWC % of sales targets for CEO
Definitions and Examples
Key Formulas for PE Operators (copy-ready)
Core definitions
- Net Operating Working Capital (NOWC)
NOWC = (Accounts Receivable + Inventory + Operating Prepaids) − (Accounts Payable + Accrued Operating Expenses + Deferred/Contract Liabilities)Exclude cash & equivalents, short-term investments, current portion of debt, and taxes/one-offs. - Change in NOWC (period over period)
ΔNOWC = ΔAR + ΔInventory + ΔOperating Prepaids − ΔAP − ΔAccrued Ops − ΔDeferred/Contract LiabilitiesCash link: cash released (used) ≈ –ΔNOWC.
If NOWC goes down, you freed cash. If it goes up, you consumed cash. - Cash Conversion Cycle (CCC)
CCC = DSO + DIO − DPO
Days metrics (use average balances)
- Days Sales Outstanding (DSO)
DSO = (Average Trade AR ÷ Revenue) × 365 - Days Inventory Outstanding (DIO)
DIO = (Average Inventory ÷ COGS) × 365 - Days Payable Outstanding (DPO)
DPO = (Average Trade AP ÷ COGS) × 365 - Inventory Turns
Turns = COGS ÷ Average Inventory DIO = 365 ÷ Turns
Days → Dollars (operator math)
- AR improvement (DSO ↓)
Cash Released ≈ (Revenue ÷ 365) × ΔDSO - Inventory improvement (DIO ↓)
Cash Released ≈ (COGS ÷ 365) × ΔDIO - AP extension (DPO ↑)
Cash Released ≈ (COGS ÷ 365) × ΔDPO
Interest savings from working-capital wins
Annual Interest Saved ≈ Borrowing Rate × Cash ReleasedEarly-pay discount economics (e.g., 2/10, net 30)
Implied APR = (Discount % ÷ (1 − Discount %)) × (365 ÷ Days Early)
Example: 2/10, net 30 → (0.02/0.98) × (365/20) ≈ ~37% APR
Worked Examples (paste into “TL;DR” or cases)
- AR example: Revenue = $100M, improve DSO by 10 days →
Cash ≈ 100,000,000 ÷ 365 × 10 ≈ $2.74Mreleased. - Inventory example: COGS = $70M, improve DIO by 12 days →
Cash ≈ 70,000,000 ÷ 365 × 12 ≈ $2.30Mreleased. - AP example: COGS = $70M, extend DPO by 7 days →
Cash ≈ 70,000,000 ÷ 365 × 7 ≈ $1.34Mreleased. - Value lens (don’t over-capitalize):
Equity impact ≈ ΔNOWC (one-time) + (EBITDA multiple × recurring savings).
E.g., $2.0M ΔNOWC + (10× × $160k/yr interest saved) ≈ ~$3.6M.
Sign Convention & Hygiene (quick checks)
- Use average AR/Inventory/AP for the period (begin + end ÷ 2).
- Keep Revenue for AR math; use COGS for Inventory/AP math.
- Reconcile ΔNOWC to the 13-week cash model; seasonality can distort quarter-end views.
- CCC does not capture deferred revenue; pair CCC with liability analysis for upfront-billing models (SaaS, maintenance).
ABL Borrowing Base (handy schematic)
Borrowing Base ≈ (Eligible AR × AR Advance Rate)
               + (Eligible Inventory × Inventory Advance Rate)
               − Reserves
Deferred revenue doesn’t increase availability; keep AR/Inventory eligible (aging, concentration, foreign caps, consignment rules).
What Breaks: NOWC Traps in Live Deals
1. One-Time AP Stretches That Reverse
Seller stretches payables before close to inflate cash. Post-close, suppliers demand normal terms and working capital spikes. Always compare AP days to trailing 4-quarter average, not just the close date.
2. Inventory Cuts That Cause Stockouts
Aggressive inventory reduction looks great on paper until the portfolio company can’t fill orders. Measure service levels alongside inventory turns. If fill rate drops below 95%, the ‘improvement’ is destroying revenue.
3. Seasonal Distortion
NOWC at close date ≠ normalized NOWC. A retailer closing in January (post-holiday) has artificially low inventory and high cash. A construction company closing in December has minimal receivables. Always normalize to trailing 12-month average or use monthly data.
4. Customer Concentration in AR
One customer at 40% of AR means one slow payment swings your entire working capital. Flag any customer >15% of AR. Model the impact of 30-day payment delay from top 3 customers.
5. Confusing Cash NWC with Operating NWC
Cash and short-term debt are NOT operating working capital. Including them double-counts items that belong in your net debt bridge. NOWC strips these out — use NOWC, not NWC, for operating analysis.
6. Missing the WC Peg in SPA Negotiations
The working capital peg determines the true purchase price. If normalized WC is set too low, the buyer overpays. If set too high, the seller leaves money on the table. The peg negotiation is where most WC value is won or lost in a deal.
90-Day Working Capital Review Checklist
Post-close working capital optimization — run this at Day 30, 60, and 90:
Accounts Receivable
- DSO vs. trailing 12-month average — improving, stable, or deteriorating?
- AR aging: what % is 60+ days? 90+ days? Trend?
- Top 5 customer payment terms documented and enforced?
- Invoice accuracy rate (disputes cause payment delays)
Inventory
- DIO vs. industry benchmark — where do you sit?
- Slow-moving/obsolete inventory identified and written down?
- Safety stock levels calibrated to actual demand variability?
- SKU rationalization: bottom 20% of SKUs by velocity reviewed?
Accounts Payable
- DPO vs. supplier terms — are you paying early? (Don’t.)
- Early payment discount analysis: is 2/10 net 30 worth taking? (Usually yes at >36% implied APR)
- Supplier payment terms renegotiated post-close?
- AP automation implemented to capture all discount windows?
Cash Conversion Cycle
- CCC trend: improving month-over-month?
- CCC vs. 3 closest public comps — competitive?
- Cash unlocked to date vs. 100-day plan target?
FAQs
Negative net operating working capital can be excellent when it results from customer advances (SaaS, retail gift cards) or efficient operations (fast inventory turns, extended supplier terms). It becomes problematic when driven by unsustainable payment stretching or cash flow stress.
NWC: All current assets minus all current liabilities (includes cash, debt)
NOWC: Only operating components (excludes financing items)
OWC: Often used interchangeably with NOWC PE prefers NOWC because it isolates operational efficiency from financing decisions.
Asset-based lenders advance against assets they can liquidate. Deferred revenue represents an obligation to deliver services, not a collectible asset. The cash has already been received.
Use the formula: (Annual Revenue or COGS ÷ 365) × Days Improved. For receivables, use revenue. For inventory and payables, use COGS.
Only when your cost of capital exceeds the implied interest rate of 37% annually. Most companies should ride full terms unless facing severe cash constraints.
Related Technical Guides
- Private Equity Value Creation Levers — WC as a value lever alongside revenue growth, margin expansion, and deleveraging
- How to Build an LBO Model — ΔNWC in the cash flow bridge and why it matters for debt paydown
- Enterprise Value vs. Equity Value — CFDF mechanics and where WC fits in the EV bridge
- Distribution LBO Case Study — WC optimization in a live $150M middle-market deal
- 5 Common LBO Modeling Traps — Trap #5: working capital errors that silently destroy returns
- Private Equity DPI — How working capital optimization shows up in realized cash-on-cash returns
- Middle-Market Definition — Deal sizes and buyer types where WC adjustments matter most
- Browse All Technical Guides — Full library of PE frameworks, models, and career resources
Update Log
- March 2026 — Removed draft placeholders, added TL;DR, traps section, 90-day checklist, cross-links, update log
- September 2025 — Original publication