Anyone can learn to link cells in Excel. That’s the price of admission. The real differentiator, or what separates a top-tier private equity candidate from the pack (besides following our private equity recruiting guide), is commercial judgment. It’s the ability to spot the subtle, return-killing traps that hide in plain sight within a model… just like these LBO modeling traps below.
This isn’t just about avoiding errors. It’s about demonstrating a deeper understanding of how a business truly generates and consumes cash. This post reveals the five most common LBO modeling traps that can derail a deal, a model, and a career. Master these, and you’ll be on your way.
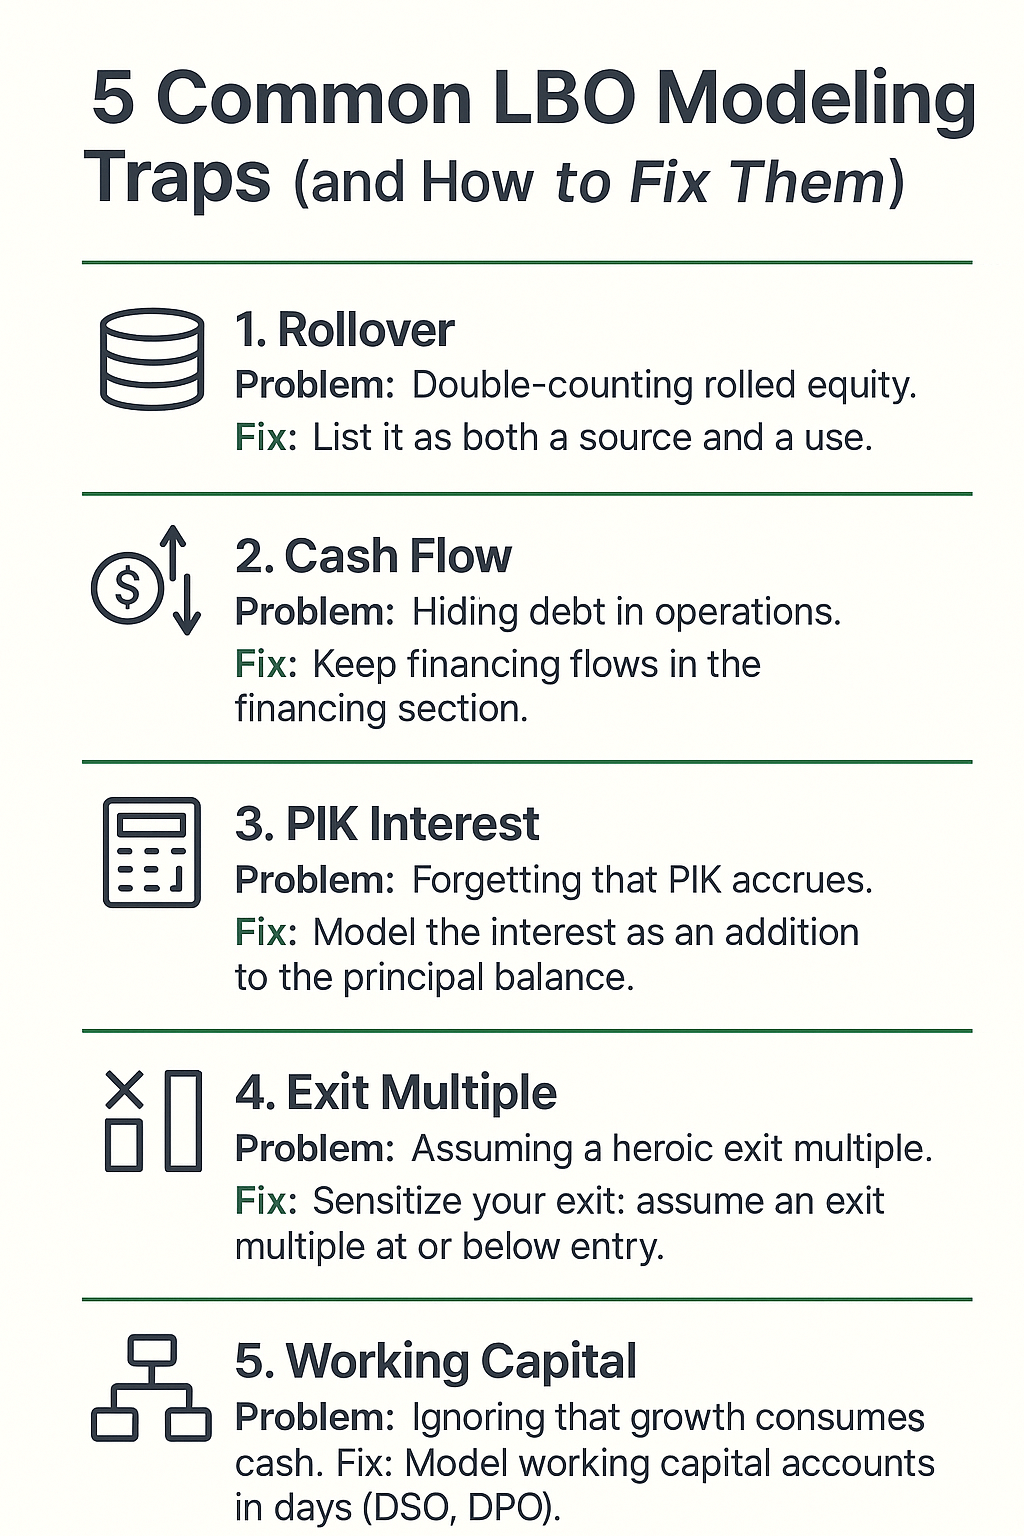
TL;DR ? The 5 Traps That Silently Break LBO Models
- Management rollover double-count ? Fix: flow rollover through both Sources AND Uses
- Burying financing cash flows in operations ? Fix: separate operating vs financing CF lines
- Ignoring PIK interest and revolver logic ? Fix: accrue PIK on balance sheet, model revolver as plug
- Pinning returns on a heroic exit multiple ? Fix: default exit = entry multiple, justify any expansion
- Working capital as an afterthought ? Fix: model ?NWC explicitly, tie to revenue growth
Each trap includes a before/after IRR impact so you can see exactly how much these errors cost.
We have a cheat sheet summarizing these at the bottom of the article for those in a rush 😉
LBO Modeling Traps: #1. The Management Rollover Double-Count
The Trap: In an LBO’s sources and uses, management’s rolled equity is a non-cash source of funds. It reduces the amount of new cash equity the sponsor must invest. The common mistake is to add the rollover to the sponsor’s check, effectively double-counting it.
Why It Matters: This error inflates the total equity invested, which distorts ownership percentages and understates the deal’s true leverage (LTM EBITDA). It’s a foundational mistake that throws the entire model out of balance.
Real-World Example: In the 2013 take-private of Dell, founder Michael Dell rolled approximately $3.7 billion of his equity. This represented nearly 11.8% of the total funding and directly reduced the cash required from the sponsor, Silver Lake Partners¹. Had an analyst mistakenly added that $3.7 billion on top of the sponsor’s check, the sources and uses would be out of balance by that exact amount.
Data Point: Management rollovers are now a majority feature in deals. According to Goodwin, 57% of mid-market PE acquisitions in 2023 included a seller rollover, up from 46% in 2020².
Illustrative IRR impact (5-year hold, same operating case; only the trap changes): With double-counted rollover (error): 28% IRR. Corrected: 22% IRR. Delta: 600 bps. On a $100M equity check, this is the difference between a top-quartile return and a median return.
The Fix
- Show the rollover equity on both sides of the Sources & Uses table.
- It is a Source (Equity from Management) and a Use (Equity to Sellers).
- The sponsor’s required cash equity injection drops dollar-for-dollar with the rollover amount.
Interview Test
“A CEO is rolling $50 million of her equity into our LBO. Show me precisely where that appears in the Sources & Uses table and explain what happens to our required cash contribution.”
Pro Tip: Rollover is a Credit, Not a Debit
Think of rollover equity as a credit to your cash check, not a debit. In a live deal, double-counting it is a foundational error that instantly signals you’re a novice.
LBO Modeling Traps: #2. Burying Financing Cash Flows in Operations
The LBO Modeling Trap: A well-built model maintains a clean separation between cash from operations (CFO), cash from investing (CFI), and cash from financing (CFF). A frequent error is burying financing activities—like revolver draws or debt repayments—within the operating cash flow section.
Why It Matters: This fatally misrepresents a company’s ability to generate cash internally. It can make a business that is starving for liquidity and borrowing heavily to stay afloat appear cash-rich. No investment committee will forgive this error.
Real-World Example: In 2013, a struggling J.C. Penney drew down $850 million from its revolving credit facility to fund inventory for the holiday season³. An analyst who booked this draw inside CFO would have shown a huge spike in operating cash flow. In reality, it was a financing move born of desperation—a fact Fitch Ratings highlighted by calling it a “stop-gap measure” signaling severe liquidity stress.
Data Point: Under U.S. GAAP, cash interest payments are included in CFO. However, new borrowings and principal repayments are classic financing activities. Know the difference. (Note: IFRS allows interest to be classified as either CFO or CFF—know your accounting framework).
The Fix
- Gotcha #1: A revolver draw is a cash inflow from financing. It is not operating cash flow.
- Gotcha #2: A principal repayment on a term loan is a cash outflow from financing.
- Gotcha #3: A full draw on a revolver outside of a crisis is a major red flag for liquidity problems.
Interview Test
“Walk me through the cash flow waterfall in your model. Where do you account for a $20 million revolver draw, and why is that separation from CFO so critical for our credit analysis?”
Pro Tip: Financing Isn’t Operations
An investment committee will never forgive confusing debt with operating cash. Always remember: financing is not operations, and mixing them makes your Free Cash Flow a fiction.
LBO Modeling Traps: #3. Ignoring PIK Interest & Revolver Logic
The Trap: Not all debt is simple cash-pay. Paid-In-Kind (PIK) interest accrues to the principal balance instead of being paid in cash. Forgetting to model this compounding effect—or the automatic “sweep” logic of a revolver—will understate leverage and misrepresent the company’s true cash position.
Why It Matters: Ignoring PIK interest understates future debt balances and overstates cash flow available for debt paydown. A model without automated revolver logic will show a negative cash balance—a nonsensical result, as a real company would have already drawn on its credit line to cover the shortfall.
Real-World Example: In 2013, the PE-owned craft store Michaels took on $800 million in PIK-toggle notes to fund a dividend payment to its sponsors, Bain and Blackstone⁴. The PIK feature allowed Michaels to defer cash interest payments by instead increasing the loan’s principal. A model that ignored this PIK accrual would have failed to capture the company’s rapidly compounding leverage, eroding equity value with each passing quarter.
Data Point: A 2024 Moody’s analysis of 120 middle-market borrowers found that roughly 25% had PIK components in their debt structures, making this a common feature to watch for⁵.
The Fix
- PIK Interest: The interest expense hits the Income Statement. On the Cash Flow Statement, the non-cash portion is added back in the CFO section. The debt principal on the Balance Sheet increases by the PIK amount.
- Revolver Logic: Build a “cash sweep” function. If cash available for debt repayment is negative, the model should automatically draw on the revolver. If positive, it should automatically pay down any outstanding revolver balance first.
Interview Test
“Our mezzanine debt has a PIK-toggle feature. Show me the three statements in your model and pinpoint how a PIK event flows through each one. Then, explain the IF/THEN logic that governs your revolver draw.”
Pro Tip: Don’t ‘Set and Forget’ Your Debt
Never “set and forget” your debt schedule. Pro models always have rules to make PIK interest snowball into the principal and to automatically draw the revolver to plug cash gaps.
Get Deal Flow Bullet — free, every Friday.
One email a week — real deal frameworks and technical breakdowns from a middle-market practitioner. No fluff.
LBO Modeling Traps: #4. Pinning Returns on a Heroic Exit Multiple
The Trap: LBO returns are extremely sensitive to the exit multiple. A lazy or overly optimistic model assumes a static exit multiple, often equal to or greater than the entry multiple, without grounding it in reality. This is a bet on favorable market conditions five years in the future—a dangerous bet.
Why It Matters: Relying on multiple expansion (selling for a higher multiple than you paid) is the riskiest source of private equity returns. If market valuations compress, a deal that looked like a 2.5x winner can quickly become a 1.5x loser, even if the company performs well operationally.
Real-World Example: The 2007 LBO of Energy Future Holdings (TXU) for $45 billion is the ultimate cautionary tale. The buyers paid a then-premium 8.5x EBITDA, betting on high power prices. Instead, natural gas prices plummeted, crushing valuations across the sector. By the time the company went bankrupt in 2014, no buyer would consider paying anywhere near the entry multiple, vaporizing the equity⁶.
Data Point: Historically, 47% of PE value creation came from multiple expansion. However, a 2023 Bain & Co. report warns that in a higher interest rate environment, this lever is an “increasingly scarce and risky strategy”⁷. (see our private equity value levers guide)
Illustrative IRR impact (5-year hold, same operating case; only the trap changes): With 1.0? exit expansion baked in (error): 31% IRR. At entry multiple flat (corrected): 19% IRR. Delta: 1,200 bps. This is the single biggest returns inflator in PE modeling.
The Fix
- Build a dynamic sensitivity table for both the Exit Multiple and LTM EBITDA.
- Your base case should almost always assume an exit multiple equal to or less than the entry multiple.
- Any case for multiple expansion must be backed by a clear thesis (e.g., higher growth, better margins, or a strategic shift).
Interview Test
“In your model, what is the IRR if the exit multiple contracts by two turns? What is the minimum exit multiple required to achieve a 2.0x MOIC, assuming our base case EBITDA projection?”
Pro Tip: Assume the exit multiple is never higher than the entry multiple.
Hope isn’t a strategy. Sensitize every deal so debt pay-down and EBITDA growth drive returns—not market luck.
- It forces you to underwrite the deal based on factors you can control (like EBITDA growth and debt paydown) rather than relying on market luck (multiple expansion).
- It signals to interviewers and investment committees that you are commercially prudent and have considered the downside risk of market multiples compressing by the time of exit.
Buy-and-Build nuance: If your thesis explicitly captures multiple arbitrage—e.g., tucking in 6× bolt-ons and exiting the roll-up at 9×—model it only in the upside case, and break out the weighted-average blended multiple so IC can see the lift is earned, not assumed.
LBO Modeling Traps: #5. Underestimating the Working Capital Drag
The Trap: Revenue growth is good. But fast growth consumes cash by increasing the need for working capital (inventory and accounts receivable). A model that assumes working capital is a fixed percentage of revenue, or remains constant, is disconnected from reality.
Why It Matters: This trap can lead to a liquidity crisis at a fast-growing company. The model might show soaring profits and ample cash for debt paydown, while the actual business is forced to draw on its revolver just to fund operations. It’s a classic case of being “too successful to survive.”
Real-World Example: Imagine a PE-owned distributor lands a massive new retail contract, boosting sales by 30%. Fantastic for EBITDA. But the new customer demands 90-day payment terms. As Boston Consulting Group founder Bruce Henderson wrote, “Fast-growth products are the most dangerous cash traps.” Revenue is vanity, profit is sanity, but cash is king—and working capital eats cash.
Data Point: A CFO Dive analysis found that 61% of high-growth companies experienced periods of negative operating cash flow despite having positive EBITDA, largely due to the cash drain from working capital⁸. (see our NOWC guide)
| Scenario | Revenue Growth | Days Sales Outstanding (DSO) | A/R Balance | ?NWC Impact |
|---|---|---|---|---|
| Base Case | $100M revenue base | 60 Days | +$11.5M | ? |
| Year 1 | +30% on $100M base | 60 Days | +$16.4M | +$4.9M |
| Year 2 | +30% on $130M base | 60 Days | +$21.4M | +$4.9M |
The cash flow impact comes from the CHANGE in NWC, not the absolute balance.
The Fix
- Accounts Receivable (A/R): Project based on Days Sales Outstanding (DSO).
- Inventory: Project based on Days Inventory Held (DIH).
- Accounts Payable (A/P): Project based on Days Payable Outstanding (DPO). This ensures that as sales grow, the absolute dollar investment required for working capital grows with them, creating a real and visible use of cash.
Interview Test
“Our model projects 20% annual revenue growth. Which specific balance sheet accounts will be most impacted, and how did you calculate the annual cash impact of that change?”
Pro Tip: Growth Eats Cash
The most impressive analysts model working capital in days (DSO, DPO) to show they understand that a business can grow itself right into a liquidity crisis.
The LBO Trap Cheat Sheet
Final Thoughts: From LBO Modeling Traps Mechanic to Investor
Avoiding these LBO Modeling five traps moves you beyond being a simple spreadsheet mechanic. It demonstrates that you think like an owner and an investor—someone who understands that the real risks in a deal are rarely found in a perfectly formatted Excel sheet. They are found in the assumptions that drive it.
Model QA Checklist (5 minutes)
- Rollover appears in both Sources & Uses and the ownership schedule (no double-count).
- Financing cash flows are separated from operating cash flow.
- PIK interest accrues on the balance sheet, and cash interest ties to the debt schedule.
- Revolver logic draws on cash deficits and pays down when cash is available.
- Exit multiple sensitivity includes an entry-multiple-flat case.
- ?NWC ties to revenue and DSO assumptions and flows through CFO.
- Sources = Uses and the cash roll-forward ties cleanly.
- Exit equity value ties to Enterprise Value minus net debt and the correct ownership percentage.
Related Technical Guides
- How to Build an LBO Model ? the 5-step guide these traps are designed to protect
- Private Equity Value Levers ? how operational improvement, multiple expansion, and deleveraging actually drive returns
- Net Operating Working Capital ? the cash-conversion framework behind Trap #5
- Private Equity DPI ? what realized cash returns look like when the model is right
- Enterprise Value vs Equity Value ? the valuation bridge underneath every sources-and-uses build
- Middle-Market Definition — deal sizes and assumptions that shift how these traps manifest
- Distribution LBO Case Study — apply these trap-checks to a live $150M deal model
- Browse All Technical Guides — full library of PE frameworks, models, and career resources
Put these fixes to work:
- Download the LBO Model Template ? build a clean model from scratch
- Master Working Capital ? the most underestimated variable in any LBO
- Run the Distribution Lab ? a full $150M MM case study
What’s the most dangerous modeling trap you’ve ever encountered? Share it in the comments below.
References
- RNFC Case Note, Dell Take-Private Overview, 2013.
- Goodwin Procter, “Use of Equity Rollovers Continues to Rise Amid Market Uncertainty,” 2024-02-27.
- Geller, M., “J.C. Penney borrows $850 mln to boost inventory,” Reuters, 2013-04-15.
- Crane, A. T., “Junk bond market could use another taper tantrum,” Reuters, 2013-08-07.
- “Moody’s finds trouble among MM CLOs,” GlobalCapital, 2024-05-10.
- Hitt, S., “How the Biggest Leveraged Buyout Ever Went Bust,” Wall Street Journal, 2014-04-29.
- Bain & Company, “Global Private Equity Report.”
- Alexis, A., “5 signs you’re about to run out of cash,” CFO Dive, 2025-04-23.
- March 2026 ? Added TL;DR, IRR impact callouts, fixed NWC table, added cross-links, and added a QA checklist
- February 2026 ? Prior revision
- September 2025 ? Original publication