Introduction
Private equity isn’t just about piling on debt and flipping companies for a quick profit. The old stereotype of PE success being driven solely by high leverage is increasingly outdated. While financial engineering (debt and clever financing) played a huge role in the LBO boom of the 1980s, today’s top investors know that creating real value requires more than just leverage.
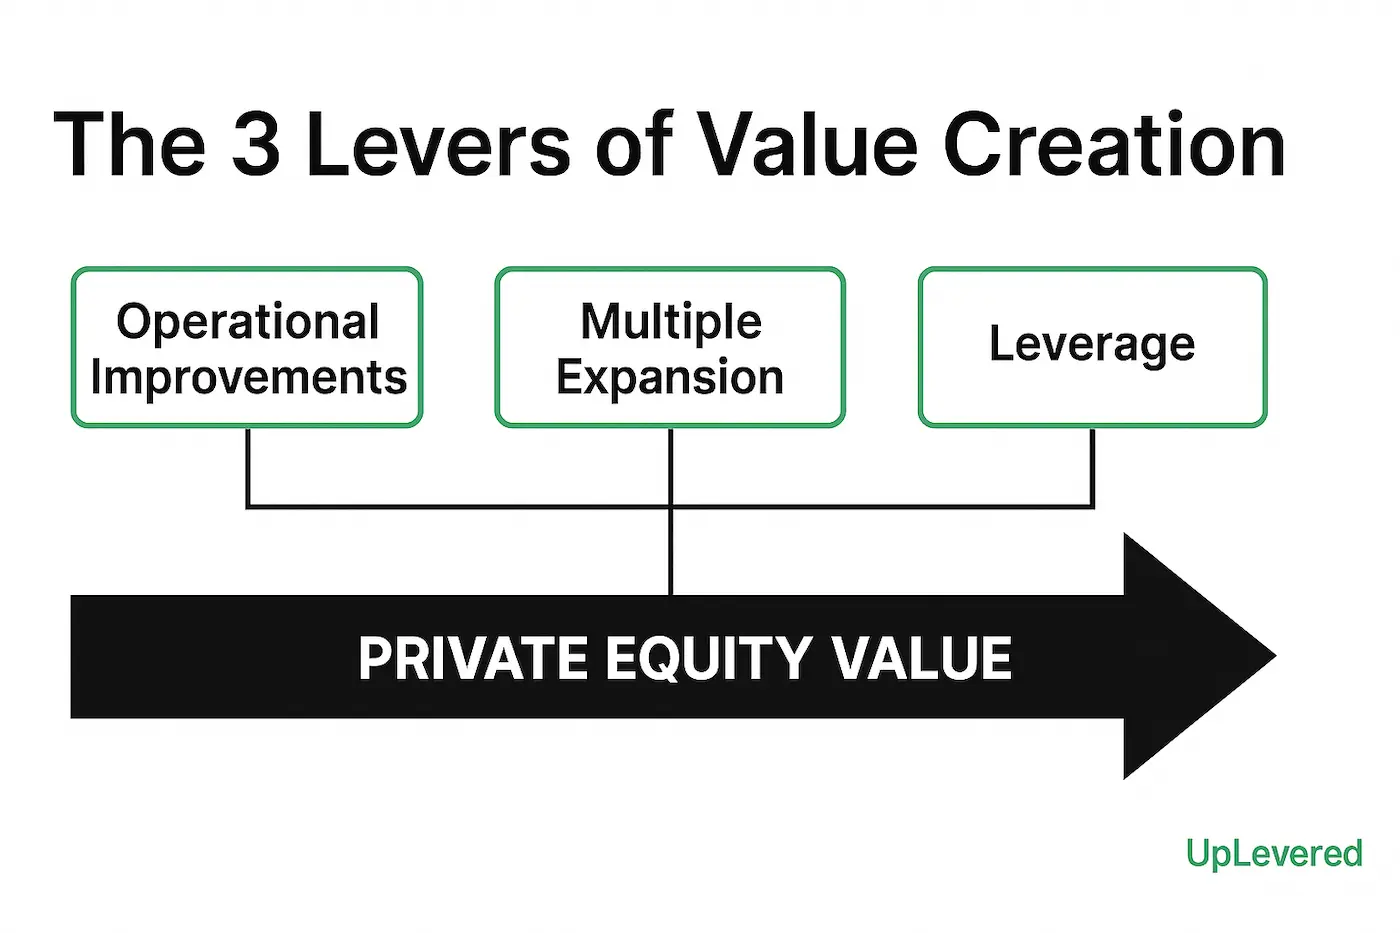
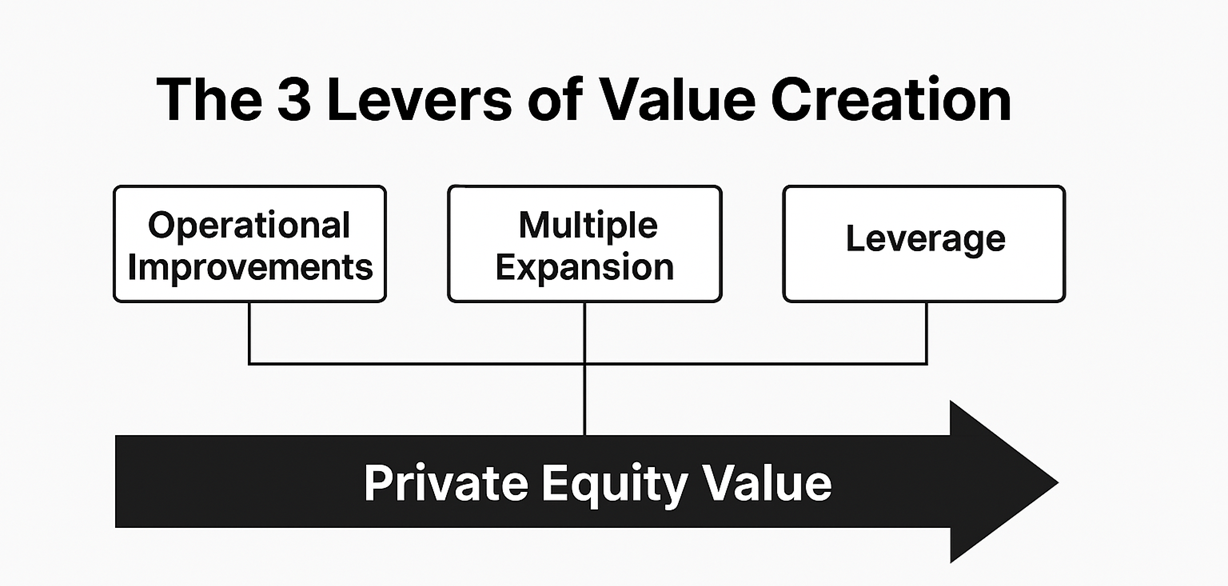
In a challenging environment, where market conditions complicate the value-creation process, private equity firms must adapt their strategies and employ more sophisticated approaches. There are three private equity value-creation levers firms rely on: deleveraging, multiple expansion, and operational improvements. This practical guide will demystify each lever and show how they work together to drive returns.
We’ll break down the classic formula of how PE firms turn an initial equity investment into a profitable exit. Then, we’ll deep dive into the two categories of value levers – financial engineering (deleveraging and multiple arbitrage) and operational improvements (EBITDA growth) – with examples and strategies. By the end, you’ll understand how improvements in earnings, changes in market valuation, and prudent debt management all factor into private equity success. Let’s start with a quick overview of the PE value creation formula.
TL;DR — Attributing Value Creation in PE
Every PE return decomposes into three levers:
- Revenue growth + margin expansion → EBITDA growth (operational)
- Multiple expansion → higher exit EV/EBITDA than entry (market/strategic)
- Deleveraging → debt paydown increases equity’s share of enterprise value (financial engineering)
Use this framework to attribute your last deal’s return. If you can’t isolate each lever’s contribution, you don’t understand the return.
? The 3 Value-Creation Levers in 30 Seconds
- Operational Upside (+200–500 bps IRR): boost EBITDA via pricing, cost cuts, and working-capital turns.
- Multiple Expansion (+150–300 bps IRR): grow moat & visibility so exit buyers pay a higher EV/EBITDA.
- Deleveraging (+100–250 bps IRR): pay down debt faster than equity grows, lifting ownership % and returns.
The “How PE Makes Money” Formula: A Quick Overview
Entry Equity Value ? (EBITDA Growth + Multiple Expansion + Net Debt Pay-down) ? Exit Equity Value
In practice, every LBO’s returns stem from some mix of these three private equity value levers during the ownership period, when the PE firm rolls up sleeves to actively manage and amp the business:
- EBITDA Growth – Grow revenue (new markets, pricing hacks) or slash costs (supply chain / vendor tweaks); larger profit $’s jack up enterprise value by a multiple ($1 x 8.0x) and your equity slice.
- Multiple Expansion – Sell at a higher EV/EBITDA than you bought (e.g., 6× in, 8× out).
- Net Debt Pay-down – Utilize free cash flow to cut debt; every $1 paid down flips straight to $1 more equity.
A $100 ? $300M equity bridge shows how returns split across those levers. Deal teams label this in a “value-creation bridge” to stay honest about what really drove IRR and MOIC.
Value Creation Analysis Traps
1. Confusing Revenue Growth with Margin Improvement
Revenue can grow while margins shrink (pricing pressure, input cost inflation, sales mix shift). Always decompose EBITDA growth into revenue × margin components separately.
2. Ignoring Working Capital in FCF
EBITDA growth means nothing if NWC absorbs all the incremental cash. A company growing revenue 20% with 25% NWC intensity is actually cash-flow negative on the margin. Always show the FCF bridge, not just EBITDA.
3. Exit Multiple Expansion as Base Case
If your base case assumes multiple expansion, your ‘operational improvement’ thesis is actually a ‘market timing’ thesis. Default: exit = entry multiple. Any expansion must be justified by demonstrable improvement (margin expansion, customer diversification, platform build, recurring revenue shift).
4. Over-Leveraging to Inflate Equity Returns
Higher leverage mechanically increases IRR — until it doesn’t. Beyond ~5× total leverage in MM deals, incremental debt increases fragility faster than it increases returns. Always show returns at 2–3 leverage scenarios.
Value Creation Bridge Checklist
Before presenting any returns attribution or IC memo:
- Bridge ties: entry equity + EBITDA growth contribution + multiple expansion contribution + deleveraging contribution = exit equity
- EBITDA growth decomposed: revenue growth × margin expansion (not just total EBITDA change)
- Multiple expansion justified with specific operational improvements, not assumed
- Deleveraging sourced: show debt paydown schedule, mandatory amort + sweep
- Base case conservative: exit multiple ≤ entry multiple unless justified
- Sensitivity tested: ±1 turn on exit multiple, ±200bps on margin, ±5% on revenue
- 100-day plan mapped to specific lever (which initiatives drive which lever?)
Due Diligence: The Launch Pad for Any Lever
Before a deal closes, PE teams dissect financials, ops KPIs, and talent depth. That diligence pinpoints which lever can move fastest: cost take-outs if COGS outpaces peers, multiple uplift if brand strength is under-priced, or deleveraging if FCF easily covers principal. Mapping findings to a 100-day plan turns insight into IRR.
Deep Dive: The Financial Engineering Levers
Private Equity Value Creation Lever #1: Deleveraging (Debt Paydown)
Using debt effectively (and then paying it down) is the original magic of leveraged buyouts. In a typical LBO, the private equity firm finances a large portion of the acquisition with borrowed money (debt). This amplifies returns on the way in – less equity up front – but the real trick is what happens during the holding period: the company’s cash flows are used to pay off that debt gradually, converting debt into equity. This is known as deleveraging.
Optimizing Capital Structure
The right debt-to-equity mix is a lever in itself. Cheap senior debt maximises equity IRR; mezzanine cushions downturns but drags cash flow. Mid-market deals typically land at 3–5× net debt/EBITDA, refinanced as EBITDA grows. Re-pricing or partial pay-down can add 100–250 bps of IRR without touching operations.
Think of it this way: if the enterprise value (EV) of the company remains the same, every dollar of debt you pay off is a dollar gained by equity holders. Here’s a simple example:
- At Entry: Buy a business worth $100 million at a 50/50 debt-to-equity split. So $50m debt, $50m equity (your investment).
- During Hold: Over several years, the company generates cash and uses $30m of it to repay debt. Debt is now only $20m.
- At Exit: Even if the enterprise value is still $100m, equity value = $100m – $20m debt = $80m. Your equity stake went from $50m to $80m just by paying down debt. That’s a 1.6× multiple without any improvement in the company’s operations.
This classic model fueled many 1980s LBO successes. In that era, over half of value creation came from debt paydown as firms bought cash-generative companies and aggressively paid off loans. Deleveraging increases equity returns (and IRR) even if the company’s total value doesn’t budge. It’s essentially a transfer of ownership from creditors to equity investors over time.
However, there are limits to this lever. First, the company needs robust and stable cash flows to service debt and avoid default – not every business can support a large debt load. Second, using high leverage increases risk: a downturn can jeopardize the company if it can’t meet interest payments. And third, there’s a finite amount of debt that can be repaid (once it’s zero, that lever is maxed out).
Numeric Example: Suppose a PE firm buys a company at 5× EBITDA for $200m EV (with $150m debt financing and $50m equity). If over five years EBITDA stays flat and EV is still $200m, but they paid down $100m of debt, the exit equity value would be $100m (since $200m – $100m debt = $100m equity). The PE equity has doubled from $50m to $100m solely via debt reduction – a testament to how deleveraging boosts equity returns.
In short, using leverage doesn’t create new enterprise value, but paying down debt shifts more of the pie to equity. It’s a tried-and-true way PE firms juice returns, especially when combined with the next of the private equity value creation levers: selling the company for a higher multiple.
Private Equity Value Creation Lever #2: Multiple Expansion
Multiple expansion (a.k.a. multiple arbitrage) means “buy low, sell high” – not in terms of price, but in the valuation multiple. In private equity, the valuation metric usually referenced is EV/EBITDA. For example, if you purchase a business at 6× EBITDA and later exit at 8× EBITDA, you’ve achieved multiple expansion. Even if the company’s earnings were unchanged, a higher EV/EBITDA multiple at sale means a higher enterprise value and thus a higher equity value.
Multiple expansion can occur due to external market factors or strategic improvements in the company (or both). Here are a few ways PE firms try to boost the exit multiple:
- Market Timing & Cycles: In frothy markets with abundant liquidity, buyers pay higher multiples. Part of PE skill is when you sell. A company bought during a recession (low valuations) might naturally fetch a higher multiple a few years later in an economic boom. Many PE exits in 2020–2021, for instance, benefited from multiple expansion simply because overall market valuations were up. However, this factor is heavily cycle-dependent – when the cycle turns, multiples can compress just as easily. PE firms can’t bank on the market always delivering a higher multiple, especially in a high interest rate environment.
- Size and Scale (“Platform” Multiple Arbitrage): Buy and build strategies are a common approach in private equity, where firms pursue add-on acquisitions and consolidation to rapidly scale operations, enhance market share, and generate value through strategic integration and increased efficiency. A larger business often commands a higher multiple than a smaller one in the same industry. For example, a platform company at $50m EBITDA might be valued at 7×, while a small tuck-in acquisition at $5m EBITDA might only be valued at 5× on its own. If the platform acquires that smaller company, the combined $55m EBITDA business could be valued at the platform’s higher multiple (say 7×), effectively creating instant value. The acquired $5m EBITDA now gets valued at 7× = $35m, whereas the PE firm might have paid $25m (5×) for it – a $10m value uplift via scale. This is pure multiple arbitrage at work, and it’s a core rationale behind many PE roll-up strategies.
- Strategic Repositioning: Sometimes a PE sponsor can reposition a company’s story or business mix so that the market assigns it a higher multiple. For instance, imagine acquiring a stodgy manufacturing firm that operates at an 8× EBITDA multiple, and then refocusing it into a tech-enabled business line that investors value at 15×. In one example, a buyer purchased a window glass manufacturer at ~8×, helped pivot the company to sell specialized glass for smartphones, and was then able to rebrand and sell it as a “tech” play at ~15× EBITDA. By moving the company into a more attractive industry segment (or even just repositioning perceptions), the PE firm captured multiple expansion without necessarily waiting on the market cycle.
- Improved Business Quality: Multiple isn’t only about industry or size – it also reflects perceived quality and risk. If during PE ownership the company diversifies its customer base, installs a top-notch management team, or achieves more predictable recurring revenue, buyers may be willing to pay more for those improved fundamentals. For example, converting one-time product sales into a subscription model could elevate the exit multiple because recurring revenue streams are valued higher. Reducing risk (deleveraging helps here too) and improving growth prospects can lead to multiple uplift by way of a better company profile.
It’s important to note that multiple expansion often lies partly outside management’s control. You can dress up a company to justify a higher multiple, but broad market sentiment plays a big role. When credit is cheap and stock markets are up, multiples expand; when interest rates and uncertainty rise, multiples tend to shrink.
Over the last decade, many buyouts benefited from a general rise in valuation multiples (helped by low rates), effectively “carrying” mediocre operational performance. Now that we’re in a higher-rate world, firms are assuming far less multiple expansion in their deal models (in some cases none at all) and focusing more on what’s next in our list of private equity valuation levers: growing EBITDA itself.
In summary, multiple expansion is a powerful but unpredictable lever – a bit of a momentum play. It’s great when you can get it, but as a PE investor you don’t want your thesis to rely on selling into a hot market. “Buy low, sell high” works best when you actively make the company more valuable to the next buyer, not just hope for a market bump.
Deep Dive: The Operational Value Lever
Private Equity Value Creation Lever #3: Driving EBITDA Growth
If financial engineering was the mantra of 1980s and 1990s PE, today’s mantra is “operational excellence.” In modern private equity, EBITDA growth is king. With purchase price multiples elevated and debt financing more constrained, the surest way to drive returns is by improving the company’s actual performance – boosting sales, expanding margins, and ultimately growing EBITDA.
Operational improvements are often referred to as the third, yet most important, of the private equity value creation levers. Unlike multiple arbitrage (which is partly luck) or leverage (which just magnifies outcomes), EBITDA growth represents true value creation – making the company fundamentally worth more. A recent study confirms this industry shift: nearly half of returns in recent deals are coming from business improvement, far more than from financial engineering or multiple arbitrage. In fact, top PE firms report that the majority of value uplift now comes from company development (revenue growth, strategic repositioning, margin expansion), with only a sliver coming from debt effects.
Why the shift? Simply put, you can no longer count on cheap debt and ever-rising exit multiples to bail you out. As McKinsey noted in 2024, about two-thirds of buyout returns for the 2010s vintages came from multiple expansion and leverage – but those levers have weakened in the current environment. Higher interest rates mean heavier debt is riskier and costlier, and today’s entry multiples leave little room for multiple expansion at exit. LP investors are also scrutinizing whether PE firms are actually building better businesses or just riding financial engineering.
Get Deal Flow Bullet — free, every Friday.
One email a week — real deal frameworks and technical breakdowns from a middle-market practitioner. No fluff.
Thus, PE firms now put operational improvements at the forefront of their investment strategy. Employee engagement is a significant factor in fostering a positive company culture and aligning employee ownership with financial and operational improvements, which can enhance company valuation. Many have in-house operating partners and playbooks for value creation initiatives ranging from pricing to digital transformation. During due diligence, sponsors spend as much time on identifying EBITDA upside (cost savings projects, growth opportunities) as on traditional financial modeling. The goal is to have a clear post-acquisition value creation plan: e.g., “We will expand into Asia, raise prices 5%, cut $10m of costs, and grow EBITDA from $50m to $80m in 3 years.” If you can execute that plan, the other private equity value creation levers (debt paydown and a reasonable exit multiple) will take care of themselves.
Let’s break down operational improvements into two categories: revenue growth and margin improvement. Both ultimately boost EBITDA, but they involve different strategies.
Revenue Growth Strategies
Driving top-line growth is often the most powerful way to increase EBITDA (and usually a sign of a healthy business). Key revenue-focused strategies used by PE owners include:
Leveraging market insights through research and data analysis helps inform these strategies, supporting better valuation, competitive positioning, and identification of growth opportunities.
- Price Optimization: Tweaking pricing strategy to capture more value for the same products. This can mean raising prices where customers are less sensitive, introducing tiered pricing, or eliminating unnecessary discounts. Small price improvements flow almost entirely to the bottom line. Research shows optimizing pricing is one of the highest-impact levers for profit growth. For example, if a software company under a PE owner realizes they can increase subscription fees by 5% without significant customer churn, that directly lifts revenue and EBITDA. Pricing excellence requires data analysis and testing, but it’s incredibly potent. (Many firms now bring in pricing specialists to portfolio companies for this reason.)
- Geographic Expansion: Entering new regions or markets to access more customers. A company might be dominant domestically, so a PE firm helps it expand to Europe or Asia, instantly enlarging the addressable market. Geographic expansion can involve opening new sales offices, targeting international client segments, or acquiring a local player in a new region. For instance, a PE-backed consumer brand might launch in Latin America or a SaaS company might start selling in Europe – driving additional sales beyond the home market. Expanding market reach is a tried-and-true way to accelerate growth.
- Upselling and Cross-Selling: Deepening customer relationships to sell more products/services per client. PE firms often implement programs to better leverage the company’s customer base – for example, training the sales team to upsell premium products or cross-sell complementary offerings. By bundling products or offering integrated solutions, companies can increase revenue per customer. Think of a PE-owned industrial manufacturer that starts cross-selling maintenance services to equipment buyers, or a software company that upsells existing clients to a higher-tier subscription. These strategies boost revenue with relatively low customer acquisition cost since you’re selling more to folks you already serve.
- Product Innovation and Expansion: Investing in R&D or product development to launch new products/features that unlock new revenue streams. A PE owner might fund the development of a complementary product line or a new flavor, model, or module that the company previously lacked. New products can re-ignite growth, attract new customer segments, or increase share-of-wallet from existing clients. For example, under PE guidance, a niche food manufacturer might roll out new flavors or healthier options that broaden its appeal. Or a B2B services firm might develop a new service offering based on client feedback. Innovation drives growth – and PE firms push portfolio companies to be proactive rather than complacent, often tightening the link between product development initiatives and tangible revenue targets.
- Sales Force Effectiveness: Often overlooked, simply making the sales engine more effective can drive substantial growth. This includes hiring additional sales reps, providing better incentives or training, improving lead generation processes, and using data/CRM tools to boost conversion rates. PE firms frequently implement rigorous sales KPIs and analytics in portfolio companies. The idea is to squeeze more revenue out of the existing pipeline by improving sales productivity. Better territory planning, refined sales pitches, and focus on high-margin customers all fall here. A more effective sales force can increase revenue growth rate without any product change – by closing more deals or bigger deals than before.
Real-world tip: In sectors like software, PE investors (notably firms like Thoma Bravo) have excelled at rapidly professionalizing the go-to-market strategy – e.g., introducing disciplined pricing and sales processes – to unlock revenue growth in founder-led companies. In industrial or consumer businesses, sponsors might expand distribution channels (new e-commerce strategy, retail partnerships) to drive sales. The specific tactics vary by sector, but the overarching theme is grow the top line in a sustainable, often systematic way.
Margin Improvement Strategies
Equally important to growing revenue is improving profit margins – i.e. making the company more efficient so that a greater percentage of revenue converts into EBITDA. Margin improvement directly boosts EBITDA even if sales don’t budge. Key margin-focused levers include:
- Cost Takeout: The bread-and-butter of many PE playbooks is cutting costs. This can range from obvious cuts (eliminating redundancies post-acquisition, closing an underutilized facility) to more strategic efficiency moves (process improvements, lean operations). Common cost takeout initiatives: optimizing manufacturing processes, renegotiating expensive leases, outsourcing non-core activities, or reducing layers of management. In the 2000s, aggressive cost-cutting (“Chainsaw Al” style) gave PE a reputation for ruthless efficiency drives. The goal is to remove waste and lower the cost structure without harming the core business. For example, a PE firm might consolidate two plants into one to reduce overhead, or implement lean Six Sigma techniques to cut production waste. Every dollar of cost saved is a dollar added to EBITDA.
- Operational Automation: Investing in technology and automation to streamline manual processes. This could involve implementing an ERP system, using robotic process automation (RPA) in back-office tasks, or automating parts of the production line. Automation can reduce labor costs, improve accuracy, and increase throughput. PE owners often fund these upgrades early in the hold period, yielding savings later. For instance, automating an assembly line might reduce labor needs and improve consistency, boosting gross margin. Similarly, automating routine accounting or customer service tasks (via software or AI bots) can reduce SG&A expenses. Embracing productivity tools and digital transformation is a key value lever in modern PE.
- Procurement & Supply Chain Savings: Optimizing procurement can significantly lower COGS (Cost of Goods Sold) and other expenses. Tactics include consolidating suppliers to get bulk discounts, renegotiating vendor contracts, sourcing from lower-cost countries, or even hedging commodity prices to manage input costs. PE firms often bring in procurement experts to find quick wins – for example, leveraging the combined volume of several portfolio companies to negotiate better rates (if they buy similar materials). Improving supply chain efficiency (better logistics, reducing expedited shipping, optimizing inventory levels) also protects margins. A classic move is a zero-based budgeting approach to expenses: justify every expense from scratch to identify savings. Especially in times of inflation, getting a grip on spending and supplier costs is crucial for value creation.
- SG&A Optimization: Streamlining Selling, General & Administrative expenses (overhead). This might involve centralizing or outsourcing certain back-office functions, eliminating duplicate roles, or rightsizing corporate HQ costs. PE firms rigorously analyze org charts to ensure the company isn’t bloated. They might merge departments, cut down on unnecessary travel & entertainment spend, or simplify product lines to reduce marketing complexity. A leaner SG&A structure means higher EBITDA margins. One common approach is to apply benchmarks: e.g., if peers operate with 15% SG&A as a percentage of sales and our company is at 20%, there’s room to trim. By building an efficient operating model that can scale without a proportional increase in overhead, PE owners boost profitability.
- Capex and Working Capital Management: Although not captured in EBITDA, controlling capital expenditures and optimizing working capital can improve free cash flow, enabling more debt paydown (indirectly boosting equity value). For completeness: PE firms ensure maintenance capex is spent wisely (no gold-plating) and projects have solid ROI. They also push portfolio companies to tighten working capital – e.g., improve collections, manage inventory – to generate cash. This doesn’t increase EBITDA, but it supports the lever of debt paydown (cash saved can reduce debt faster).
Data Analytics: 3 Fast Wins and Examples:
- Dynamic Pricing: Algorithmic price lifts raised gross margin 180 bps in Year 1.
- Working-Capital Radar: SKU-level day-sales insights freed $6 m cash, funding capex.
- Supplier Re-bid Engine: Machine learning flagging volume shifts cut COGS 3 %.
The best outcomes usually come from a combination of revenue growth and margin improvement. For instance, a PE firm might help a company grow revenue 30% and expand EBITDA margins from 20% to 25%. The compounding effect on EBITDA is powerful (in that example, roughly 62.5% increase in EBITDA).
It’s worth noting that which levers matter more can depend on the situation and sector. In a high-growth tech company, revenue growth may be the primary story (even if margins are temporarily low). In a mature manufacturing business, cost and margin improvements might be the bigger focus. Many industrial buyouts lean heavily on cost reduction early on, whereas software buyouts might prioritize sales expansion or pricing upgrades. Sector-specific behaviors: Firms like Thoma Bravo (tech-focused) are known for aggressive cost discipline and rapid revenue add-ons in software, while an industrial-focused fund might emphasize lean manufacturing and global expansion. Good PE investors tailor the playbook to the company’s reality.
To summarize, operational improvements drive EBITDA growth either by making the business bigger (revenue up) or more efficient (costs down). In today’s private equity landscape, this is the lever that separates the winners from the laggards. As one industry study put it, “46% of overall returns are now driven by business improvement…with top-line (revenue) measures contributing two-thirds of that”. The era of easy money and multiple arbitrage is giving way to an era where “you must build a better business to earn a great return.”
Putting It All Together: IRR Attribution in the Real World
How do these private equity value creation levers translate into actual investment results? Private equity professionals use IRR (Internal Rate of Return) attribution analysis to break down, after an exit, how much of the return came from each lever. In simple terms, they’ll ask: Out of our total value creation, how much was due to EBITDA growth, how much to multiple changes, and how much to net debt changes?
This is often visualized in a “value creation bridge” or waterfall chart in deal reports. For example, imagine a bar chart where you start at the entry equity value, then add a bar for the increase from EBITDA growth, another for the increase from multiple expansion, and another for the increase from debt paydown, arriving at the exit equity value. Such breakdowns bring transparency: everyone can see whether the investment thesis was validated (e.g., if you underwrote 20% EBITDA CAGR, did that actually happen?) or if the returns mostly came from fortuitous multiple expansion.
In practice, here’s how you calculate each component:
- EBITDA Growth contribution: Take the change in EBITDA from entry to exit, and multiply it by the entry valuation multiple. This shows how much higher the enterprise value became thanks to higher earnings, holding the multiple constant. It answers “how much value came from improving operating performance?”
- Multiple Expansion contribution: Take the change in the EV/EBITDA multiple from entry to exit, and multiply it by the exit EBITDA. This isolates the effect of the market/investor sentiment – what value was gained (or lost) purely from the change in what buyers are willing to pay per dollar of earnings.
- Net Debt Paydown contribution: Simply take the net debt at entry minus net debt at exit (assuming no new equity in between). This is the value transferred to equity by paying down debt (and also includes any cash dividends taken, which would reduce equity value).
Add these up and you’ll reconcile to the total change in equity value. If you convert that to percentages or IRR contribution, you can discuss which of the private equity value creation levers drove how many basis points of IRR.
Why does this matter? Because it holds the deal team accountable to the original plan and helps identify where value was truly created. Private equity investment memos (both at deal inception and exit reviews) often explicitly discuss the “IRR split” or MOIC split from these drivers. For instance: “On our $100m equity investment, EBITDA growth contributed $150m of value, multiple expansion $30m, and debt paydown $20m,” which might be roughly 15%, 3%, and 2% out of a 20% IRR annually.
If a deal’s returns rely too heavily on one of the private equity value creation levers, it’s a risk signal. An overreliance on multiple expansion, for example, might prompt questions like “Are we sure we’ll get this 12× exit multiple in 5 years? What if it’s only 10×?”. Likewise, if the model shows most value coming from debt paydown, one might ask “Is this business actually growing, or are we just financially engineering a return?” Ideally, PE firms and their investors (LPs) want to see a balanced contribution, with a significant chunk coming from EBITDA growth – evidence that the PE firm’s operational efforts paid off.
In portfolio reviews, firms use these analyses to steer resources too. If halfway through the hold period it’s clear that, say, revenue growth is lagging but the market multiple has expanded, they know the value creation gap is in operations and will double down there. Monitoring portfolio performance is especially important during periods of economic downturns and market volatility, as these factors can impact investment returns. Conversely, if performance is great but market conditions have deteriorated (multiple compression), they might strategize on timing exits or additional operational improvements to compensate.
Another real-world use is in GP marketing to LPs: When raising a new fund, PE firms showcase case studies of past deals with value bridges to demonstrate their value creation capability. Demonstrating a proven track record in improving business operations, pricing, and sales strategies is key to establishing credibility with investors. A chart that shows 70% of value from EBITDA growth and 20% from multiple expansion (and only 10% from leverage) looks a lot better than one showing the reverse. It tells investors, “We drive returns by improving companies, not just financial tricks.” For example, Bridgepoint (a UK PE firm) revealed that across two decades, ~77% of their value creation came from revenue and margin improvements, not from debt and multiple arbitrage. That’s a selling point in today’s market.
To sum up, IRR attribution is how PE measures success under the hood. Informed decision making relies on accurate financial reporting and performance tracking, supporting strategic interventions and stakeholder communication. It’s a reminder that, at the end of the day, real value comes from growing earnings and making smart investments, whereas reliance on leverage or lucky multiples is not a repeatable strategy. Modern PE professionals are expected not just to model these levers, but to execute on them – and then articulate to their stakeholders exactly how each deal made money.
(If you’re building LBO models yourself, always include a returns attribution tab. Crafting an effective exit strategy is crucial for achieving a successful exit and maximizing returns. It forces you to think critically about what’s driving the model. Be wary of models where 80% of the upside is from an assumed exit multiple pop or excessive leverage – those are red flags. For more on common modeling pitfalls, see our guide on LBO modeling traps to avoid.)
Conclusion
Leverage, multiples, and EBITDA – those are the three pillars of private equity value creation. By paying down debt, selling at a higher multiple, and growing the company’s earnings, PE firms transform the businesses they buy and generate returns for their investors. In the past, you could argue the first two private equity value creation levers (financial engineering) were doing most of the work. But the industry has evolved: today the spotlight is on operational excellence and EBITDA growth as the key to lasting value. The best PE investors are essentially business builders – they think like owners, strategists, and even CEOs, not just financiers.
For anyone looking to break into private equity (or advance in it), it’s critical to internalize these concepts. Think like an investor: when evaluating a company, ask how you could increase its EBITDA, whether the market might value it more highly in the future, and how you’d manage its capital structure. In diligence and in modeling, break down the sources of value – don’t just project a high IRR, explain what’s driving it. This mindset will not only help you impress in interviews and memos, but also steer you toward better decisions in managing real investments. (We emphasize this “investor mindset” in our Private Equity Resume Template guide – showing you understand value creation levers can set you apart.)
In the end, private equity success comes from a balanced use of all three private equity value creation levers. Integrating sustainable practices, such as ESG initiatives and environmentally friendly operations, is also increasingly important for enhancing a company’s resilience, market position, and appeal to socially conscious investors. Use debt wisely, but don’t over-rely on it. Buy at a fair (or low) multiple, and try to sell at a better one – yet don’t count on luck. And above all, grow the business’s profits. As the saying goes in PE circles: “You can financial-engineer a deal to get in, but you have to earn your way out.
Frequently Asked Questions (FAQ) on Private Equity Value Creation Levers
Selling a company at a higher EV/EBITDA or EV/Revenue than you paid. Improvements in growth prospects, margins, or strategic fit make buyers accept a richer multiple, adding 150–300 bps of IRR on a five-year hold.
Each dollar of debt paid down transfers value from lenders to shareholders. If EBITDA grows while net debt falls, equity value can double with no multiple change, adding roughly 100–250 bps of IRR on mid-market deals.
Operational improvement, as pricing gains, gross-margin lift, procurement savings almost always moves the needle most. Because EBITDA sits in both the numerator of valuation (EV = EBITDA × multiple) and the cash-flow stream, a 10% EBITDA bump can add more IRR and MOIC than modest multiple expansion or deleveraging alone. Multiple uplift and debt pay-down sweeten the outcome, but ops wins are the engine.
In the first 100 days, quick wins like SG&A trimming fund later growth initiatives. After baseline EBITDA lifts, shift focus to high-ROI capex or add-on acquisitions.
A detailed roadmap outlining the first quarter of operational, commercial, and financial actions post-close. It aligns management and investors on timing, accountability, and KPI targets for each lever.
A managing director provides strategic leadership and operational oversight within private equity firms. They guide product development, team building, and execute operational improvements that drive value creation.
Post-merger integration is critical for ensuring stability and continuity during organizational transitions. Interim leadership and strategic talent placement are essential to manage talent and leadership effectively throughout the integration process.
Navigating regulatory compliance is essential for successful value creation, as private equity firms must manage it alongside other challenges like economic volatility to ensure portfolio companies remain compliant and competitive.
Strategic guidance, delivered through comprehensive advisory services throughout the investment process, helps portfolio companies achieve sustainable growth and competitive advantages.
Proactive talent management, such as interim leadership and leadership continuity, can give private equity firms a competitive edge by providing a strategic advantage over rivals.
References:
- E78 Partners (John Signa) – “Private Equity in 2025: Five Key Levers Driving Value Creation.” (March 28, 2025) – Emphasizes that creative financial engineering alone no longer suffices, and top firms focus on operational and strategic value levers.
- Corporate Finance Institute – “LBO Returns Attribution: What Drives Equity Value.” – Defines the core drivers of LBO returns (EBITDA growth, multiple expansion, net debt paydown) and how to calculate each component in a value creation analysis.
- RSM Global – “Why have add-on acquisitions been key to PE deal volume…?” (Dec 19, 2022) – Explains how add-on acquisitions create valuation uplift through multiple arbitrage. Example given: a smaller company at 5× EBITDA folded into a larger platform at 7× can immediately be worth more as part of the combined entity.
- BizGro Partners – “Multiple Arbitrage: A Primer.” (June 17, 2020) – Describes scenarios of multiple arbitrage, including repositioning a company into a higher-multiple industry (e.g., turning an 8× EBITDA manufacturing business into a 15× tech-focused play by shifting its product mix).
- CFA Institute – Enterprising Investor (Sebastien Canderle) – “Tricks of the Private Equity Trade, Part 1: Value Drivers.” (Oct 11, 2022) – Outlines five PE value drivers. Notably, it remarks that multiple arbitrage is heavily dependent on market cycles and cites examples like EQT’s 98% of value coming from company improvements vs 2% from debt repayment. Also discusses how PE firms present value bridges in fundraising (e.g., Bridgepoint’s 77% from operational improvements).
- Simon-Kucher & Partners – “Private Equity Value Creation – The Eras Tour: 2024 Value Creation Study.” (Sept 26, 2024) – Highlights the industry’s shift to growth-driven value creation. Finds 46% of overall returns now come from business improvements (with revenue growth two-thirds of that) and notes that improving the core business is the number one driver of target returns today.
- Insight2Profit (Matt Busch) – “Mastering the Art of Pricing: How Private Equity Can Maximize Valuation.” – Discusses pricing as a value creation lever in PE. Emphasizes cross-selling and upselling opportunities to drive revenue and profitability, noting that bundling products/services can deepen customer relationships and boost revenue per client.
- DealEdge (Bain & Co.) – “Creating Value in Private Equity: Moving Beyond Multiple Expansion.” (Blog, March 19, 2024, referencing Bain Global PE Report 2024) – Observes that over the last decade, buyout funds largely ignored margin expansion and relied on multiple expansion and revenue growth. With higher interest rates, firms must refocus on operational improvements. Lists initiatives for margin expansion: optimizing pricing, enhancing sales effectiveness, driving operational efficiencies, and pursuing product innovation. Also notes that top-quartile deals had significantly more margin improvement than average deals.
- Boston Consulting Group (BCG) – “How PE Firms Fuel Next-Level Value Creation.” (Feb 19, 2016) – Analyzes the increasing importance of buy-and-build and operational improvements. Provides historical breakdown: in the 1980s, 51% of buyout value came from deleveraging, which fell to 13% by 2012, while operational improvement’s share rose from 18% to 48% by 2012. Describes how operational improvements drive value via new products, geographic expansion, improved pricing, better sales force, and cost reductions in SG&A. This reference reinforces how value creation sources have shifted over time.
Apply these frameworks:
- Build the Model — quantify all three levers in a live LBO
- EV vs Equity Value — the bridge that connects entry valuation to your returns
- DPI: Why Cash Beats Paper — how LPs measure whether your value creation actually converted to distributions
Related Technical Guides
- Enterprise Value vs Equity Value — the valuation bridge behind every multiple-based return
- How to Build an LBO Model — where the three value levers actually show up in the returns math
- Private Equity DPI — how realized distributions prove whether value creation converted to cash
- Middle Market Definition — the size band where most of these leverage and multiple assumptions live
- Net Operating Working Capital — the free-cash-flow lever most models underwrite too loosely
- Distribution LBO Case Study — see all three value levers at work in a live $150M deal
- 5 Common LBO Modeling Traps — errors that misstate the returns these levers are meant to drive
- Browse All Technical Guides — full library of PE frameworks, models, and career resources
Stay sharp. Subscribe to Deal Flow Bullet.
Weekly PE frameworks, deal analysis, and career intel for middle-market practitioners. Free, every Friday.
- March 2026 — Added TL;DR, value creation traps, bridge checklist, cross-links to EV guide
- February 2026 — Fixed Matplotlib artifact, repaired citations, formatting cleanup
- September 2025 — Original publication