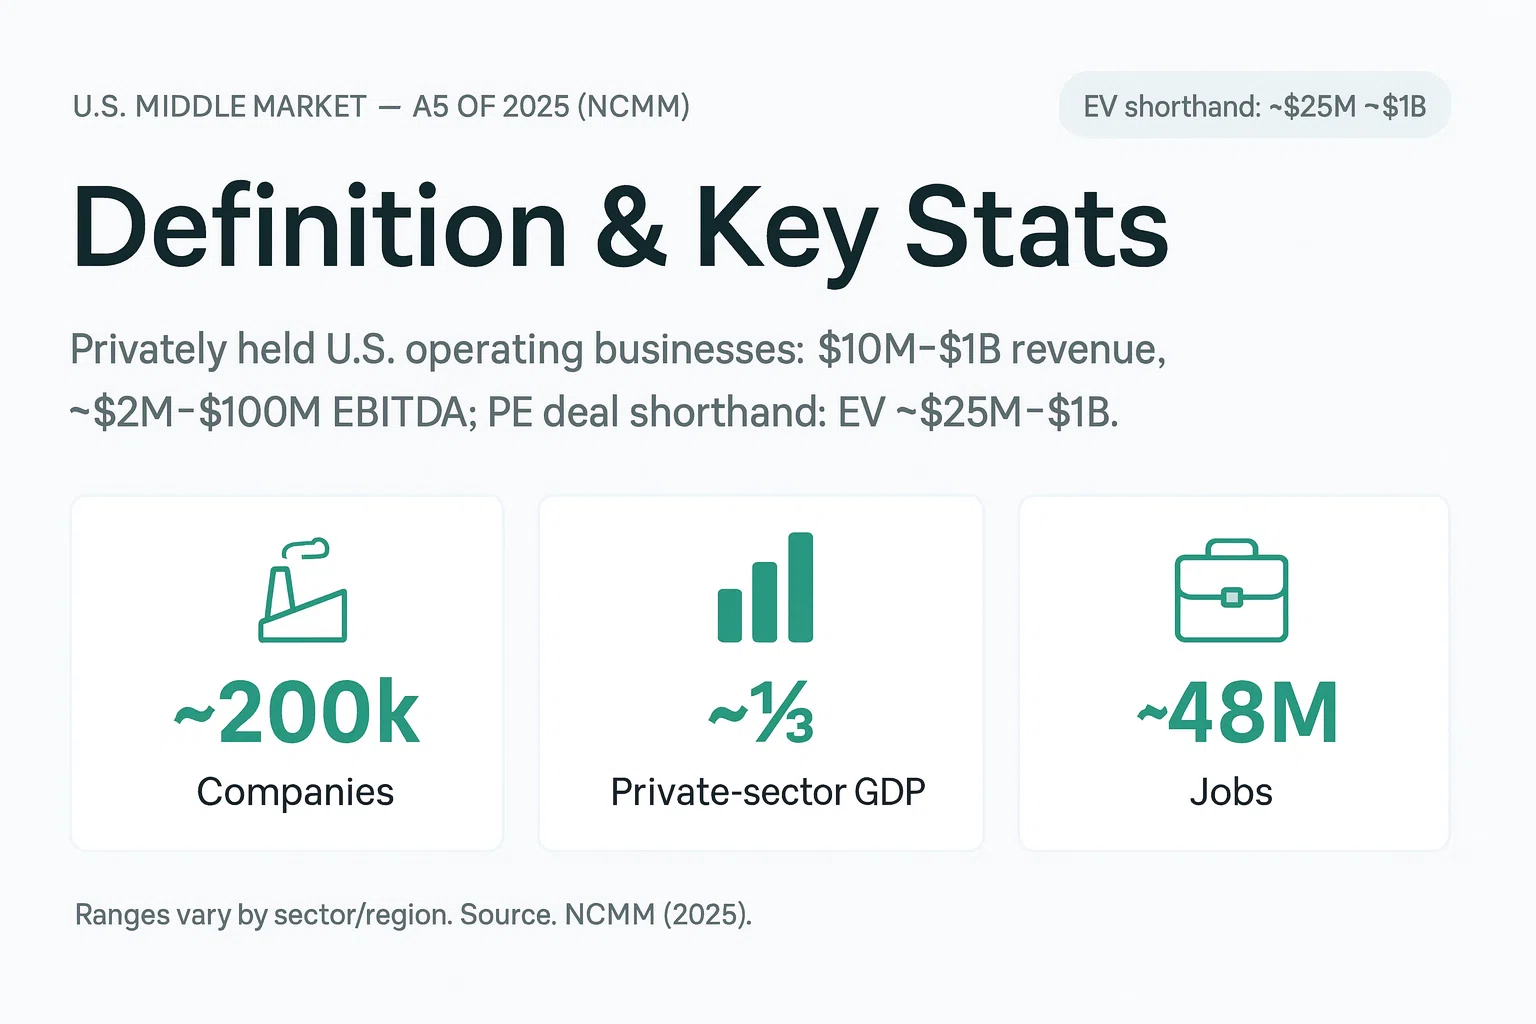
While there’s no single definition for middle-market companies that everyone agrees on, we’re generally talking about privately held U.S. operating businesses pulling in ~$10M–$1B in revenue per PitchBook. In dealmaking terms, most private-equity transactions in this segment fall around ~$25M–$1B in enterprise value (EV). Note ranges can vary by industry and region; use revenue for operational scale and EV for deal size.
In the wild, we practitioners tend to focus more on EBITDA bands—typically ~$2M–$100M. Even these ranges aren’t set in stone. So, it’s those companies that are bigger than your neighborhood pizza joint, but smaller than the Fortune 500 giants.
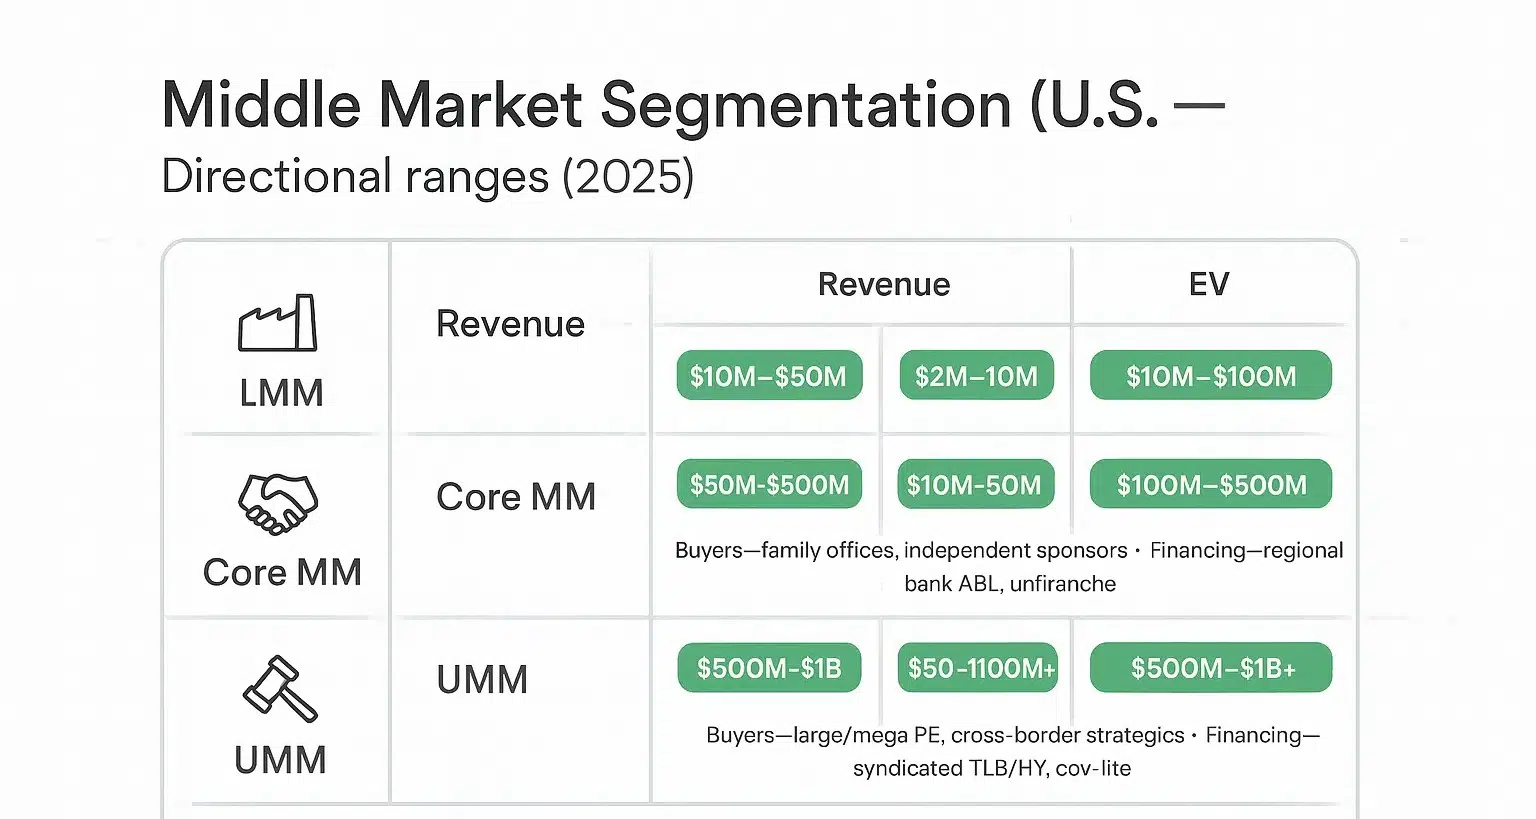
This critically important segment sitting between small businesses and large corporations can be further subdivided into three buckets: lower, core, and upper middle market—which, not coincidentally, is the primary hunting ground for most U.S. middle-market private equity shops.
- NCMM Middle Market Indicators: company counts, GDP/jobs share, trendlines.
- PitchBook / practitioner references: middle-market deal EV shorthand (~$25M–$1B).
- GF Data / bank & trade reports: size-based EV/EBITDA ranges; premium for scale.
TL;DR — Defining the Middle Market for PE
There’s no universal definition — it shifts by geography, framework, and who’s talking. Here’s the practitioner shorthand:
- Lower Middle Market (LMM): $10M–$75M TEV / $3M–$15M EBITDA
- Core Middle Market (MM): $75M–$500M TEV / $15M–$75M EBITDA
- Upper Middle Market (UMM): $500M–$1B TEV / $75M–$150M EBITDA
Use enterprise value for deal sizing and buyer classification. Use revenue/EBITDA for operational benchmarking. Always specify geography and framework when citing a definition — ‘middle market’ means different things at Bain Capital vs. a family office in Dallas.
Key Takeaways
- Approximately 200,000 U.S. middle market companies account for about one-third of private sector GDP and employment according to the National Center for the Middle Market (2025)
- Three primary segments: Lower Middle Market ($10M-$50M revenue), Core Middle Market ($50M-$500M revenue), Upper Middle Market ($500M-$1B revenue)
- Primary hunting ground for private equity with typical enterprise value ranges of $25M-$1B+, featuring prevalent buy-and-build strategies
- Distinct from mid-cap public stock indices and Small-Medium Enterprise (SME) frameworks, which use different classification criteria
- Directional EV/EBITDA valuation ranges rise with company scale, though multiples vary significantly by industry and market cycles
Middle Market Segmentation and Characteristics
The middle market encompasses three distinct segments, each characterized by different operational scales, buyer universes, and transaction dynamics. Understanding these segments is crucial for finance practitioners navigating private equity, investment banking, and lending in this space.
Lower Middle Market (LMM)
Lower middle market companies have historically represented more than 90% of all middle-market companies.
Typically generate $10 million to $50 million in annual revenues with $2 million to $10 million in EBITDA. These businesses employ approximately 50 to 200 people and often remain owner-operated with less formal processes. The buyer universe primarily consists of family offices, independent sponsors, and smaller private equity funds. Financing typically comes from regional banks, business development companies, and private credit providers, with debt packages often including asset-based lending components.
Core Middle Market
Firms in this range span $50 million to $500 million in annual revenue with $10 million to $50 million in EBITDA. Employee counts range from 200 to 1,000, and these companies typically feature more institutional processes and professional management teams. The buyer universe expands to include broader private equity funds and strategic acquirers. Financing options deepen significantly, with national banks, mezzanine providers, and unitranche lenders offering more sophisticated capital structures.
Upper Middle Market (UMM)
For companies that generate $500 million to $1 billion in revenue with $50 million to $100 million or more in EBITDA. These larger enterprises employ 1,000 or more people and operate with institutional-grade processes. Large private equity funds, public strategic buyers, and cross-border acquirers actively pursue these assets. Financing typically includes syndicated bank facilities and covenant-lite structures become more common.
Buyer universe differences expand significantly across segments. Lower middle market deals often involve direct owner negotiations with limited auction processes. Core middle market transactions frequently feature controlled auction processes managed by boutique investment banks. Upper middle market deals typically involve formal auction processes led by bulge bracket or top-tier middle market investment banks.
Important Note: These ranges are directional and adjust by sector and region. Software companies with recurring revenue models may achieve similar EBITDA at lower revenue levels due to higher margins, while capital-intensive manufacturing businesses may require higher revenue to generate comparable EBITDA.
Market Segmentation Table
| Segment | Revenue | EBITDA | Enterprise Value | Headcount | Typical Buyers | Financing Sources | Process Characteristics |
|---|---|---|---|---|---|---|---|
| Lower Middle Market | $10M-$50M | $2M-$10M | $10M-$100M | 50-200 | Family offices, independent sponsors, smaller PE | Regional banks, BDCs, private credit | Direct negotiations, limited auctions |
| Core Middle Market | $50M-$500M | $10M-$50M | $100M-$500M | 200-1,000 | Broad PE funds, strategics | National banks, unitranche, mezzanine | Controlled auctions, boutique bankers |
| Upper Middle Market | $500M-$1B | $50M-$100M+ | $500M-$1B+ | 1,000+ | Large PE, public strategics, cross-border | Syndicated facilities, cov-lite structures | Formal auctions, bulge bracket coverage |
Directional and illustrative only. Participation varies by fund mandate and market cycle.
Note: Tech/SaaS: recurring revenue often valued on ARR or at higher EBITDA multiples; Industrials/Distribution: more cyclical, higher capex and concentration pull multiples down.
See our Equity Value vs. Enterprise Value valuation primer to learn more about bridging these two core metrics.
Illustrative Buyers & Lenders by Segment
Lower Middle Market (LMM)
- Representative buyers: The Riverside Company; Shore Capital Partners; Trinity Hunt Partners; Summit Park; Gauge Capital; Kinderhook Industries; H.I.G. Capital (LMM).
- Representative lenders / direct credit: Golub Capital; Antares Capital; Ares Capital Corp (ARCC); Twin Brook Capital Partners; Monroe Capital; NXT Capital; Barings.
Core Middle Market (MM)
- Representative buyers: Audax Private Equity; HGGC; Wind Point Partners; One Equity Partners; The Sterling Group; Charlesbank; GTCR.
- Representative lenders / direct credit: Ares Management; HPS Investment Partners; KKR Private Credit; Blue Owl; Blackstone Credit & Insurance; Churchill (Nuveen); MidCap Financial (Apollo); Golub; Antares.
Upper Middle Market (UMM)
- Representative buyers: KKR; Blackstone; Carlyle; TPG; Apollo; Bain Capital; Advent; CD&R; Hellman & Friedman; Warburg Pincus; large strategics (Fortune 1000).
- Lenders / underwriters: JPMorgan; BofA Securities; Goldman Sachs; Morgan Stanley; Citi (syndicated TLB/HY); Ares; KKR; HPS; Blackstone; Apollo; Sixth Street (unitranche/direct lending).
- ABL — asset-heavy, seasonal working capital; borrowing base (AR/inventory) matters.
- Cash-flow term loan / Unitranche — stable EBITDA, clean add-backs, sponsor support; faster close.
- Syndicated TLB / High-Yield — larger UMM scale, ratings-ready story, broad lender universe.
Economic Significance of Middle Market Companies
Key stats (as-of 2025 and sourced from NCMM, United States):
- 200,000 middle-market companies (NCMM).
- ~⅓ of private-sector GDP (NCMM).
- ~30% of private-sector employment (~48M jobs) (NCMM).
- Primary private-equity focus; typical deal EV sits in the $25M–$1B band (PitchBook/practitioner ranges).
- Middle market companies generate over $10 trillion in annual revenues, underscoring their critical role in the economy (BlackRock).
Growth contrast (2023–2025): Post-pandemic performance surged into 2024, with revenue and employment growth exceeding historical averages, and then normalized in 2025 while remaining solidly positive. Between 2023 and 2024, middle-market firms outpaced both small businesses and large corporations, before cooling toward long-run trends in 2025, yet still maintaining healthier levels than pre-COVID baselines. Specifically, peak year-over-year revenue growth reached 12.9% in mid-2024, moderating to 10.7% by mid-2025, while employment growth declined from 10.3% to 7.3%, accompanied by a noted drop in executive sentiment in 2025.
Middle market businesses play a vital role in the U.S. economy, representing a disproportionate share of economic activity relative to their numbers. Despite their small number, middle market companies have a significant impact on revenue generation and employment within the economy. According to the National Center for the Middle Market’s 2025 research, approximately 200,000 middle market companies account for roughly one-third of private sector GDP and support over 48 million jobs across the United States as of 2025.
To put this in perspective, if the U.S. middle market were a standalone economy, it would rank as the fifth largest in the world as of 2025. These middle market organizations generate over $10 trillion in total revenue collectively as of 2025, demonstrating their crucial role in driving economic growth and employment. The success can be partially attributed to how middle-market firms benefit from agility in decision-making and strategic planning compared to larger businesses.
Employment impact extends beyond raw job numbers. Middle market firms often provide more stable employment than small businesses while offering greater career mobility than larger enterprises. These companies frequently serve as training grounds for executive talent and entrepreneurial leadership that eventually migrate to larger organizations or start new ventures.
Post-pandemic growth patterns show middle market companies have demonstrated resilience and adaptability. From 2023 to 2025, middle market firms have generally outpaced both small businesses and large corporations in revenue growth, with middle market companies growing at an average annual rate of approximately 6.5%, compared to 3.6% for large corporations and 4.2% for small businesses, though this performance varies significantly by sector. Manufacturing, business services, technology, and healthcare represent the largest industry concentrations within the middle market.
Geographic distribution concentrates in major metropolitan areas, with significant clusters in the Northeast, Southeast, and West Coast regions as of 2025. However, middle market businesses maintain a broader geographic footprint than large corporations, contributing to local communities and regional economic development.
The size and resilience of the middle market—plus fragmentation in many sub-sectors—explain why buy-and-build and operational engineering are repeatable value-creation plays here.
International Context
European “mid-caps” defined by the European Investment Bank typically employ 250 to 3,000 employees as of recent years, roughly aligning with U.S. middle market scale, though European definitions emphasize headcount over revenue metrics. Additionally, global middle-market companies are increasingly look to exports and international markets for growth opportunities.
Outside the U.S.: the EU “SME” framework caps “medium” at <250 employees, while the EIB “mid-caps” run 250–3,000 employees—closer to the U.S. “middle market” by scale. Always state geography and framework when quoting figures.
- NCMM Middle Market Indicators (2024–2025): company counts, GDP/jobs share, trendlines.
- PitchBook / practitioner references: middle-market deal EV shorthand (~$25M–$1B).
- GF Data / bank reports: U.S. 2024–2025 size-based EV/EBITDA ranges and scale premia.
Get Deal Flow Bullet — free, every Friday.
One email a week — real deal frameworks and technical breakdowns from a middle-market practitioner. No fluff.
Private Equity and Middle Market Investment Thesis
Private equity firms view middle market companies as offering multiple levers for value creation, making these businesses the primary focus for institutional buyout strategies. Middle market companies often face significant challenges, such as limited access to capital, operational inefficiencies, and the need for professionalized management. Private equity plays a critical role in supporting the growth and transformation of these companies by providing resources, expertise, and strategic guidance. The investment thesis centers on operational and governance engineering opportunities that are often more pronounced than in large-cap deals.
Operational engineering involves hands-on improvements across commercial processes, cost structures, and supply chain optimization. Middle market firms frequently lack sophisticated pricing analytics, sales enablement tools, or procurement leverage that private equity can implement through operating partners and external consultants. Working capital optimization represents another key lever, as many middle market businesses maintain inefficient inventory management, accounts receivable processes, or supplier payment terms.
Governance engineering focuses on professionalizing management structures and reporting systems. Many middle market companies operate with founder-led teams that lack institutional reporting cadence, key performance indicator tracking, or formal board governance. Private equity sponsors typically implement quarterly board meetings, monthly financial reporting packages, and performance dashboards that drive accountability and decision-making speed.
Buy-and-build strategies dominate middle market private equity, particularly in fragmented service industries. Sponsors acquire a platform company with strong management and operational capabilities, then pursue add-on acquisitions to drive scale, geographic expansion, and cross-selling opportunities. This approach allows funds to capture market consolidation trends while building larger, more valuable enterprises.
Multiple expansion potential exists but requires careful execution and market timing. Moving a business from lower middle market to core middle market scale can command higher exit multiples, but success depends on actual operational improvements, market positioning, and buyer appetite at exit. Quality improvements and growth acceleration reduce buyer risk perception, justifying premium valuations.
Cash generation and deleveraging remain central to middle market private equity returns. Typical hold periods of four to seven years allow sufficient time to pay down acquisition debt through operating cash flows while implementing operational improvements. This deleveraging reduces equity risk and enhances returns, particularly when combined with operational EBITDA growth.
Buy-and-Build Strategy Flywheel
The buy-and-build approach follows a systematic flywheel that creates value through scale and operational improvements over a typical four to seven-year hold period.
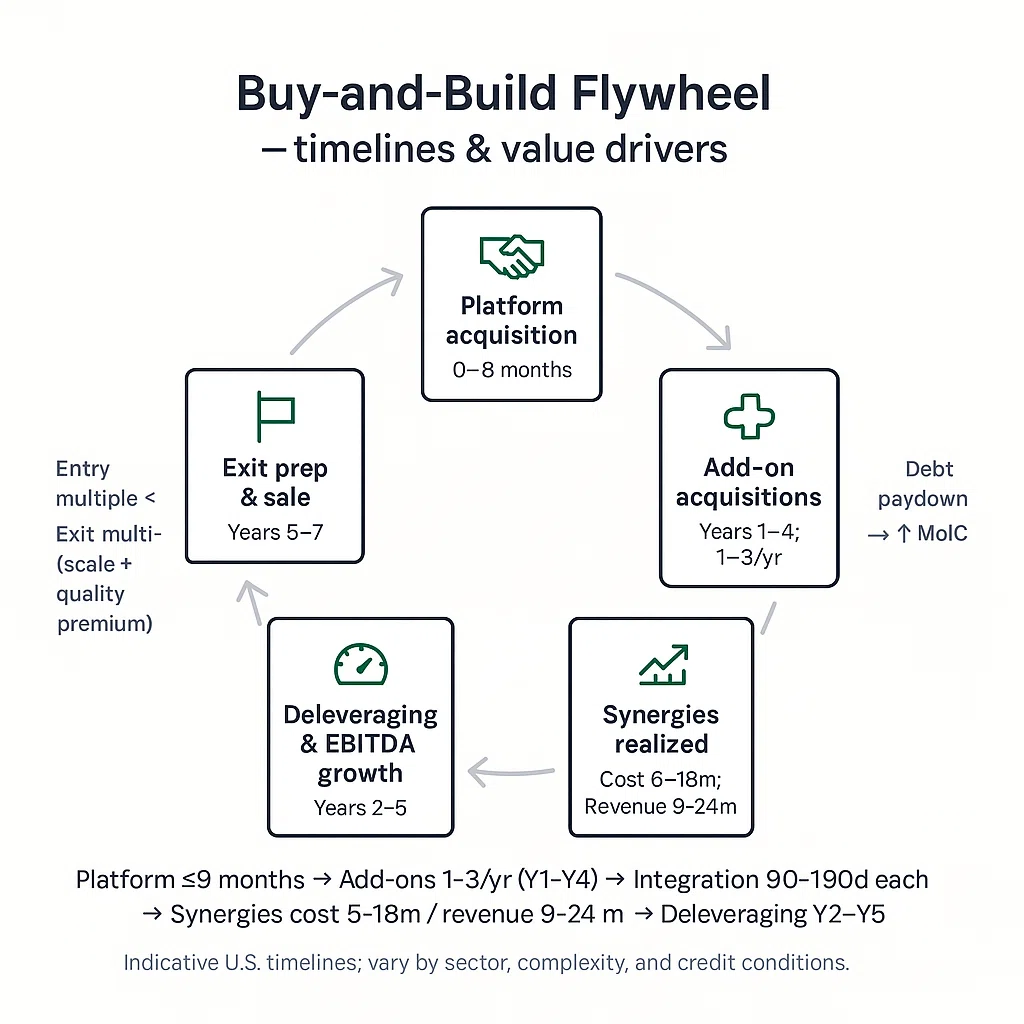
Platform Acquisition (Months 0-9): Sponsors identify and acquire a market-leading company with strong management, scalable systems, and acquisition capacity. The platform typically represents 60-80% of the ultimate enterprise scale, providing the foundation for subsequent add-ons.
Add-on Acquisitions (Years 1-4): Systematic pursuit of complementary businesses occurs at a pace of one to three acquisitions annually. Add-on companies typically trade at lower multiples than the platform due to smaller scale, owner-operator dynamics, or operational limitations. Pipeline management and dedicated business development become critical success factors.
Integration (90-180 Days per Add-on): Rapid integration focuses on systems consolidation, overhead elimination, and best practice sharing. Successful integrations typically follow standardized playbooks covering IT systems, accounting consolidation, sales force integration, and facility rationalization.
Synergy Realization: Cost synergies emerge through overhead reduction, procurement leverage, and operational efficiency improvements. Revenue synergies develop through cross-selling, geographic expansion, and enhanced service capabilities. Working capital improvements often provide immediate cash generation opportunities.
Scale and Professionalization: As enterprise scale grows, the business attracts higher-quality management talent, deeper customer relationships, and institutional-grade processes. The managing director plays a key role in leading strategic decision-making and ensuring effective integration throughout the buy-and-build process. Talent acquisition becomes increasingly important for attracting the right people to support growth and drive innovation as the business scales. Larger scale enables investment in technology, compliance systems, and market expansion that smaller competitors cannot match.
Exit Preparation (Years 5-7): Enhanced scale, professionalized management, and improved market position typically command premium valuations from strategic buyers, larger private equity funds, or public markets. The combination of debt paydown and multiple expansion drives equity returns.
Cadence at a glance
• Platform close: months 0–9 (thesis → LOI → diligence → close).
• Add-ons: 1–3 per year in years 1–4 (capacity-dependent).
• Integration sprints: 90–180 days per add-on (systems, people, process).
• Synergies: cost in 6–18 months; revenue in 9–24 months.
• Deleveraging: years 2–5 (cash generation reduces net leverage).
• Exit window: years 5–7 (larger, de-risked asset; broader buyer set).
• Rate-limiter: integration bandwidth (leadership, data, ERP/CRM).
• Entry vs add-on pricing: add-ons are often acquired at lower multiples than the platform (size/competition gap).
Integration checklist (90–180-day sprint)
- People: org chart, role clarity, retention plan, sales comp alignment.
- Systems: ERP/CRM cutover, data mapping, single source of truth.
- Process: procure-to-pay, order-to-cash, close cadence, KPI scorecards.
- Commercial: price harmonization, cross-sell playbook, key-account play.
- Supply chain: SKU rationalization, vendor consolidation, freight terms.
- Controls: DOA matrix, covenant calendar, weekly cash/13-week CF.
Middle Market vs. Large-Cap Buyouts and Venture Capital
Middle market private equity differs significantly from large-cap buyouts and venture capital in deal dynamics, risk profiles, and professional development opportunities.
Why it matters: Middle-market buyouts sit between venture’s binary risk and large-cap’s hyper-efficient auctions—meaning more room for hands-on value creation at sane entry prices.
| Feature | Venture Capital (VC) | Middle-Market PE | Large-Cap PE |
|---|---|---|---|
| Deal size (typical) | $5–20M checks | $25M–$1B EV | $1B+ EV |
| Leverage | Minimal/none | Moderate–high (sponsor & credit driven) | High; syndicated/club |
| Diligence focus | Team/TAM/product | Commercial/operational/QoE | Scale synergies/regulatory/debt |
| Operating intensity | Advisory; founder-led | High: pro ops, integration, KPIs | Moderate: scale programs |
| Hold period | 4–7 yrs (often longer) | 5–7 yrs | 4–7 yrs |
| Common exits | IPO/strategic | Strategic or sponsor-to-sponsor | Sponsor-to-sponsor/strategic/IPO |
- Entry pricing: Middle-market entry multiples often < large-cap due to competition/scale gap; quality and cycle can invert.
- Process: Auction formality rises with size; Mid-Market still allows proprietary/limited-process deals.
- Value drivers: MM = ops engineering + buy-and-build + deleveraging; large-cap leans on scale, financing, and mega-synergies.
- Risk mix: VC = product/market fit risk; MM = execution/integration risk; large-cap = financing/market beta.
When each strategy wins
- VC: outsized upside where product-market fit inflects; power-law returns.
- Middle-market PE: fragmented sectors, operational uplift, add-ons at lower multiples.
- Large-cap PE: mature assets, global footprint, scale synergies, deep capital markets.
Deal dynamics vary substantially across market segments. Middle market transactions often involve direct engagement with company founders or family owners, creating more relationship-driven negotiations. Large-cap deals typically feature formal auction processes managed by bulge bracket banks with extensive due diligence timelines. Larger businesses in the large-cap segment benefit from established resources, scale, and infrastructure, giving them advantages in deal execution and negotiation leverage compared to middle market companies. Venture capital focuses on growth-stage companies with limited historical financial performance, emphasizing market opportunity and management team assessment.
Risk and return profiles reflect different value creation strategies. Middle market deals offer multiple levers for operational improvement but carry higher key-person risk and customer concentration exposure. Large-cap buyouts provide more stable cash flows and established market positions but offer fewer operational improvement opportunities. Venture capital targets exponential growth potential but accepts higher failure rates and longer development timelines.
Investment role exposure differs significantly across segments. Middle market professionals typically engage directly with portfolio company management on operational initiatives, board participation, and strategic planning. Large-cap roles often focus on financial engineering, public market dynamics, and institutional investor relations. Venture capital emphasizes market development, product strategy, and business model evolution.
Hold periods and exit strategies reflect different investment approaches. Middle market holds typically span four to seven years with exits to strategic buyers or larger private equity funds. Large-cap deals may pursue shorter hold periods with public market exits or dividend recapitalizations. Venture capital investments often require seven to ten years with exits primarily through public offerings or strategic acquisitions.
Capital requirements and competition intensity vary by segment. Middle market deals typically require $50 million to $300 million in equity capital with moderate competition levels. Large-cap transactions demand billions in equity with intense auction competition. Venture capital investments range from millions to hundreds of millions with competition focused on specific market segments or geographies.
The pace of add-ons should match integration capacity; scaling too fast without systems/data discipline creates drag that erodes synergy capture and delays deleveraging.
Challenges and Risk Factors in Middle Market
Middle market companies face distinct challenges that create both investment risks and value creation opportunities for private equity sponsors and other stakeholders. As the business landscape evolves, these companies must also address new challenges such as cybersecurity threats, climate change-related risks, and innovations in digital insurance.
How to mitigate (short & sweet):
• Key-person risk: formal succession plan, retention/earn-out, document critical processes, second-line leaders in seat within 6–12 months.
• Management depth: upgrade CFO/COO where needed, weekly KPI cadence, board-level operating partner, clear DoA (delegation of authority).
• Customer concentration: multi-thread key accounts, pricing MOUs, targeted new logos by segment, expand wallet share with cross-sell, term extensions.
• Supplier concentration: dual-source critical SKUs, VMI/consignment where feasible, hedging/long-lead visibility, quarterly cost-pass-through review.
• Capital access constraints: right-size leverage, diversify lenders (bank + private credit), covenant cushion ≥20–25%, quarterly refinancing read.
• Covenant pressure: 13-week cash + covenant calendar, monthly LTM bridge, pre-wire add-backs, early waivers if headwinds persist.
• IT/data maturity gaps: single source of truth (data warehouse), ERP/CRM roadmap, data dictionary + owner, close calendar automation.
• Cyber/privacy: MFA everywhere, least-privilege access, patch SLA, tested incident response, cyber insurance tuned to revenue profile.
• Reporting/controls: monthly close ≤10 business days, QoE-ready adjustments, audit-trail PO-to-pay and order-to-cash, inventory cycle counts.
• Market fragmentation/positioning: crisp ICP and pricing strategy, tuck-ins to build local density, brand/SEO for category authority.
• Regulatory/ESG: materiality screen, policy + evidence file, owner for compliance KPIs, quarterly audits on high-risk workflows.
Red flags & what to show in diligence
- Customer concentration: any single customer >20% revenue; show pipeline by segment, churn/NRR, and contract terms.
- Working capital strain: DSO trending up, inventory turns falling; show 13-week cash, AR aging, slow-mover list.
- Leverage headroom: fixed charge <1.2x or springing covenants; show covenant model, waiver history, lender calls.
- Data quality: conflicting bookings/billings, manual spreadsheets; show data map, lineage, and reconciliation process.
- Cyber/control gaps: shared admin accounts, stale patches; show MFA status, IR runbook, last tabletop test.
Key-person risk represents a primary concern in middle market businesses where founders or small management teams control critical customer relationships, operational knowledge, or strategic decision-making. Succession planning often remains informal or incomplete, creating vulnerability to management departures. Mitigation strategies include management team expansion, knowledge documentation, and retention incentive programs.
Capital access constraints limit growth opportunities and create financing market dependencies. A middle market business often faces unique funding challenges, as these firms typically rely on bank relationships rather than public debt markets, making them vulnerable to credit cycle fluctuations. Covenant structures tend to be more restrictive than large-cap financing, requiring careful cash flow management and lender relationship maintenance. Private credit markets have expanded financing options but often at higher costs than traditional bank lending.
Customer and supplier concentration risks are common challenges for middle-market businesses, where top customers may account for 20-40% of revenue and key suppliers often control critical inputs. Many middle-market executives identify maintaining strong customer relationships as a top priority. High customer concentration exposes companies to revenue volatility and limits pricing flexibility, while supplier concentration can disrupt operations and increase costs. Effective risk mitigation strategies focus on diversifying relationships, improving contract terms, and enhancing supply chain resilience to safeguard business continuity.
Data and IT infrastructure maturity gaps complicate due diligence processes and integration planning. Many middle market companies lack integrated enterprise resource planning systems, centralized financial reporting, or sophisticated business intelligence capabilities. Quality of earnings analysis often reveals accounting inconsistencies or revenue recognition issues that require remediation. Technology investments become critical for operational improvement and scalability.
Covenant pressure and financial reporting requirements intensify with institutional financing structures. Middle market companies must maintain quarterly compliance testing, monthly reporting packages, and annual audits that may exceed historical practices. Covenant violations can trigger default scenarios or require expensive amendments. Enhanced reporting requirements demand upgraded finance functions and systems capabilities.
Market fragmentation and competitive positioning challenges affect growth strategies and exit planning. Many middle market companies operate in fragmented industries where market leadership requires continuous acquisition activity. Competitive positioning may depend on local relationships rather than sustainable competitive advantages. ESG implementation and regulatory compliance requirements continue expanding, creating additional operational complexity and investment requirements.
Each risk is also a value-creation lever: the earlier it’s surfaced in diligence, the faster your 100-day plan compounds EBITDA and de-risks the exit multiple.
Common Misconceptions and Clarifications
Several important distinctions separate the private middle market from related but different business classifications that practitioners encounter regularly.
Mid-cap Stock Indices vs. Private Middle Market: These terms are not interchangeable. Public mid-cap indices (e.g., S&P MidCap 400) classify companies by market capitalization, a metric focused on stock performance. In contrast, the “middle market” designation refers to private companies classified by operational metrics like revenue and EBITDA for M&A and investment purposes. Crucially, most private middle market companies, if publicly traded, would be considered small-cap or micro-cap stocks, falling far below public mid-cap valuation thresholds.
Small and Medium Enterprises (SME) frameworks differ from middle market definitions in purpose and thresholds. U.S. Small Business Administration definitions focus on policy objectives and government contracting eligibility, using industry-specific employee counts and revenue limits that often include much smaller businesses. European SME frameworks emphasize employment levels and balance sheet metrics for regulatory compliance rather than investment segmentation. Middle market definitions serve transaction and investment purposes with higher revenue thresholds.
Revenue-based versus market capitalization-based classifications serve different analytical purposes. Private market transactions focus on revenue and EBITDA metrics because they reflect operational scale and cash generation capacity. Public market classifications emphasize market capitalization because they measure investor valuation and trading liquidity. Professional service firms, technology companies, and asset-light businesses may achieve middle market revenue scale while maintaining relatively modest asset bases.
Regional definition variations reflect different economic structures and regulatory frameworks. European “mid-caps” typically emphasize employee counts due to labor market regulations and social policies. Asian markets often incorporate local currency thresholds and industry-specific metrics. U.S. definitions remain revenue and EBITDA focused due to private equity market standardization and credit market practices.
Industry-specific middle market parameters require contextual adjustments for accurate classification. Software companies with recurring revenue models may achieve middle market EBITDA at lower revenue levels due to higher margins and asset efficiency. Manufacturing and distribution businesses typically require higher revenue to generate comparable EBITDA due to working capital requirements and capital intensity. Service businesses fall between these extremes with moderate asset requirements and variable margin structures.
Valuation and Transaction Multiples
Enterprise value to EBITDA multiples serve as the primary valuation metric for middle market transactions, though ranges vary significantly by segment, industry, and market conditions. Financial analysis is essential in evaluating these transactions, as it helps determine appropriate valuation multiples and assess the underlying financial health of target companies.
EV/EBITDA as the primary metric reflects cash flow focus and debt capacity analysis in leveraged buyout transactions. Adjusted EBITDA calculations normalize for one-time items, owner compensation, and accounting irregularities identified during quality of earnings analysis. Private equity sponsors typically underwrite deals based on normalized EBITDA that reflects sustainable operating performance under institutional ownership.
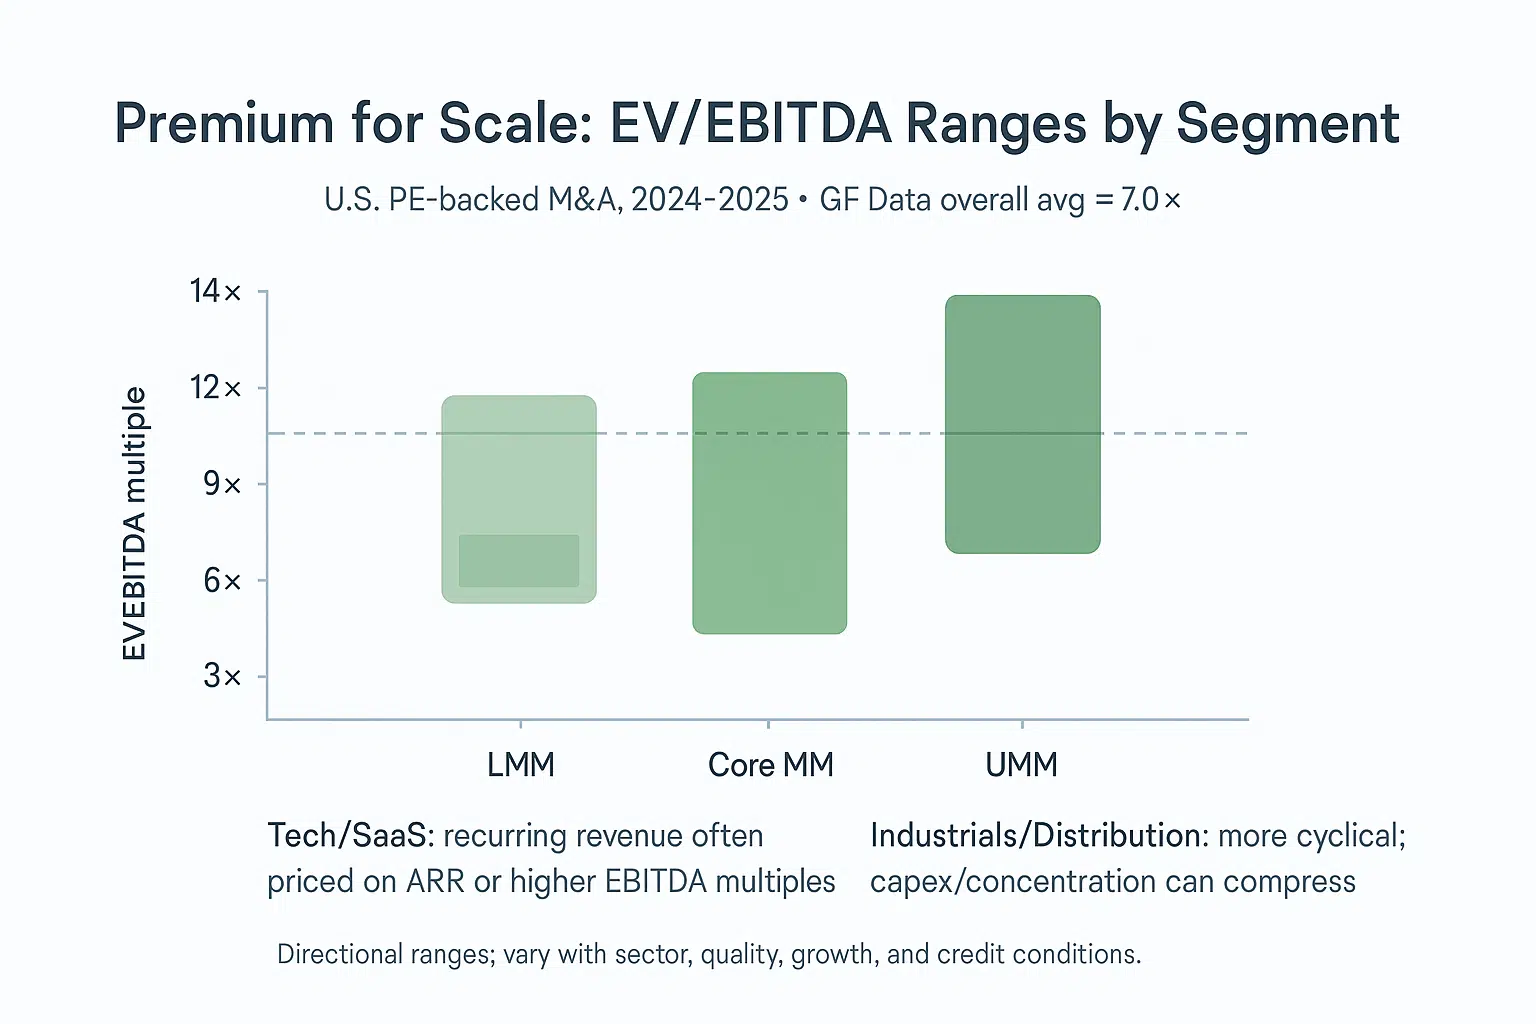
Directional ranges (U.S. 2024–2025): LMM 6.0×–8.0×, Core MM 8.0×–12.0×, UMM 9.0×–13.0×+. Sector, quality, growth, and credit conditions drive dispersion. See the Directional Multiples Table below.
Sector variance significantly affects valuation levels within each size segment. Technology companies with recurring revenue models typically command premium multiples due to predictable cash flows and growth potential. Healthcare services businesses often trade at premium valuations due to defensive characteristics and demographic trends. Industrial and distribution companies generally trade at moderate multiples reflecting cyclical exposure and capital intensity. Business services firms span wide valuation ranges depending on recurring revenue characteristics and client concentration.
Revenue and ARR multiples apply primarily to software and subscription businesses where recurring revenue provides predictable cash flow streams. Software companies often trade on revenue multiples ranging from 2x to 8x annual recurring revenue, with premiums for growth rates, customer retention, and market position. Rule of 40 analysis combines growth and profitability metrics to assess software company performance and valuation premiums.
Lease treatment, working capital adjustments, and earnouts require careful analysis in middle market transactions. Lease accounting under ASC 842 and IFRS 16 affects both enterprise value and EBITDA calculations, requiring consistent treatment for comparable analysis. Working capital pegs establish closing adjustment mechanisms for seasonal businesses or growth companies. Earnout structures bridge valuation gaps between buyers and sellers, particularly in businesses with uncertain growth prospects or integration risks.
Market cycle sensitivity affects valuation levels and transaction volume throughout economic cycles. Interest rate environments influence debt capacity and equity return requirements. Credit market conditions determine financing availability and covenant structures. Economic uncertainty typically compresses valuation multiples and extends transaction timelines as buyers demand higher returns for perceived risks.
Directional Multiples Table
Premium for scale: Larger deals command higher multiples. GF Data’s report as of H1’25shows an overall average near ~7.0× EV/EBITDA, with a clear step-up into the core/upper middle market. Directional ranges below reflect U.S. PE-backed M&A (2024–2025) and vary by sector, quality, growth, and credit conditions.
| Segment (EV) | EV/EBITDA Range | Drivers (short) |
|---|---|---|
| LMM (<$100M EV) | 6.0×–8.0× | Smaller scale; key-person risk; concentration |
| Core MM ($100M–$250M) | 8.0×–12.0× | Scale ↑; systems; broader buyer set |
| UMM ($250M–$500M) | 9.0×–13.0×+ | Scale premium; competitive processes |
Note: Industry and market cycle variance can result in multiples outside these ranges; quality and growth characteristics drive premium valuations
Larger, more diversified companies command higher multiples because perceived risk falls with scale (deeper teams, broader customers, stronger systems, better capital access). Credit conditions amplify or compress this: easier financing supports higher prices; tighter credit pushes buyers toward lower leverage and more conservative bids.
Industry / Sector Examples
- Tech/SaaS: often valued on ARR/revenue when EBITDA isn’t a clean proxy; EBITDA multiples typically carry a premium to industrials due to recurring revenue and growth.
- Healthcare services: steady demand; reimbursement risk; premiums for scale, compliance maturity, and de novo runway.
- Industrials/distribution: more cyclical; pricing power and customer concentration drive spread; maintenance capex matters.
- Business services: contract length, net revenue retention, and labor intensity drive dispersion.
Normalization quick list:
- Adjusted EBITDA (QoE): strip one-offs, owner comp, non-recurring items.
- Leases: align treatment across comps.
- Working capital peg: normalize NWC to avoid price leakage.
- Earnouts: useful where growth or visibility is uncertain.
Note: Figures reflect U.S. middle-market private deals circa 2024–2025; sector and cycle variance expected
Middle Market Banking and Advisory Services
Middle market investment banks and commercial banks provide specialized services tailored to the unique needs of companies in this segment, differing significantly from bulge bracket capabilities and small business banking.
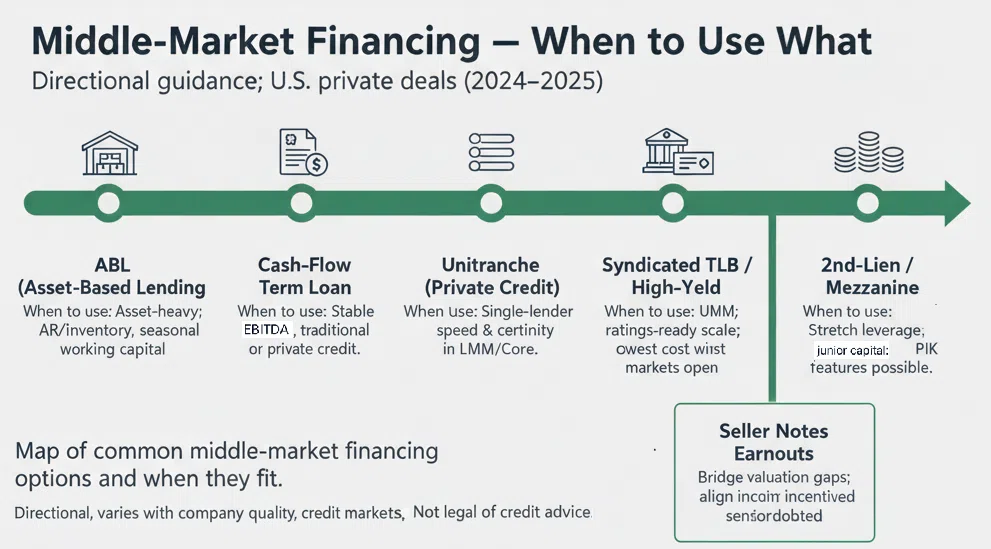
Financing: when to use what
- ABL (asset-based revolver/term): asset-heavy, seasonal working capital; AR/inventory borrowing base; good for LMM/industrial/distribution.
- Cash-flow term loan: stable EBITDA, proven cash conversion; faster close than syndicated; often paired with revolver.
- Unitranche (direct lending): single-doc simplicity; speed and certainty; sponsor reputation matters; common in LMM/Core MM. Bank debt is the most common capital source for lower middle market companies that are financially strong.
- Second-lien / mezzanine: stretch leverage where cashflow visibility is solid but senior appetite caps out; often with warrants/tighter covenants.
- Syndicated TLB / HY bonds: UMM scale, ratings-ready story, broad lender universe; use when size and liquidity justify syndication costs.
- SBIC / BDC capital: flexible solutions for smaller deals or bespoke structures; can bridge valuation or timing gaps.
- Seller notes / earnouts: align incentives when visibility is limited; useful for bridging growth or customer-concentration risk.
- Public or government-sponsored companies can also be a source of capital for middle-market or lower-middle market firms.
Tiny note: product choice depends on leverage tolerance, variability of cash flows, collateral quality, and speed/certainty needs.
Debt process (deal flow)
- Teaser & asks: leverage, structure, covenants, fees, timeline.
- Term sheets: competing proposals; sensitivity to add-backs and QoE.
- Credit work: lender diligence, model cases, downside tests, collateral review.
- Docs & conditions: MACs, financial covenants, baskets, restricted payments.
- Close & funding: funds flow, WC peg true-up, post-close deliverables.
- Post-close cadence: monthly reporting, covenant calendar, 13-week cash.
Covenant quick map
- Maintenance: total/leverage, interest/fixed-charge, min liquidity.
- Incurrence: debt baskets, liens, investments, restricted payments.
- Equity cures: availability, limits, dilution considerations.
Investment banking services for middle market transactions focus on sell-side advisory, buy-side representation, and capital raising activities. Boutique and middle market investment banks typically maintain sector expertise and relationship-driven coverage models that emphasize long-term client development. These firms often provide more senior-level attention and customized service approaches compared to bulge bracket banks that may treat middle market deals as training opportunities for junior staff.
Commercial banking relationships and lending products serve as primary financing sources for many middle market companies. Asset-based lending facilities provide working capital financing secured by accounts receivable and inventory. Cash flow lending structures offer term loans and revolving credit facilities based on EBITDA and debt service coverage. Club deals allow multiple banks to participate in larger facilities while maintaining relationship banking approaches rather than broadly syndicated structures.
Private credit and business development company financing has expanded significantly as an alternative to traditional bank lending. Unitranche structures combine senior and subordinated debt in single facilities with streamlined documentation and covenant packages. BDCs and SBICs provide debt and equity financing with specialized middle market focus and regulatory advantages. Mezzanine financing bridges the gap between senior debt and equity with current pay and equity participation features.
Debt syndication processes become more formal in larger middle market transactions. Lead arrangers typically retain significant exposure while syndicating portions to participant banks. Covenant-lite structures emerge in upper middle market deals but remain less common than in large-cap transactions. Market flex provisions allow arrangers to adjust pricing and terms based on investor demand during syndication periods.
Strategic advisory services encompass merger and acquisition representation, restructuring advice, and capital structure optimization. Middle market companies often require guidance on exit planning, management buyout structuring, and succession planning. Carve-out transactions and corporate development advisory represent growing service areas as large corporations divest non-core assets and middle market companies pursue acquisition strategies.
The right instrument tracks the cash-flow profile, not the sponsor’s wish list; speed and certainty often trump a few basis points.
Career Opportunities and Professional Development
Middle market finance offers distinct career paths with different skill development opportunities and progression timelines compared to large-cap finance or venture capital.
Career exposure (why MM is different)
- PE (Associate→VP): full life-cycle reps (sourcing, diligence, ops with management); heavy buy-and-build/integration exposure.
- Investment banking (Analyst→Associate): lean teams, direct CEO/founder contact earlier; sell-side process orchestration.
- Corporate development: serial acquirer playbook, synergy tracking, integration PMO with business owners.
Middle market private equity roles provide broader operational exposure and faster responsibility advancement than mega-fund positions. Associates typically engage directly with portfolio company management on operational initiatives, board meeting preparation, and add-on acquisition sourcing. The lean team structure common in middle market funds means professionals often work across multiple deal functions rather than specialized roles, developing more comprehensive investment skills.
Middle market investment banking roles feature earlier client contact and deal responsibility compared to bulge bracket positions. Analysts and associates often participate in management presentations, due diligence sessions, and negotiation processes that would be VP-level responsibilities at larger firms. The relationship-driven business model provides exposure to long-term client development and industry expertise building. See our IB vs PE article on more of the key differences.
Corporate development positions in companies that acquire middle market targets offer strategic planning and business development experience. These roles typically involve market analysis, acquisition target identification, due diligence coordination, and post-merger integration planning. The operational focus provides valuable experience for professionals considering operating roles or entrepreneurial ventures.
Compensation expectations vary by role type and geographic location but generally offer competitive packages with performance-based components. As mentioned in our PE Salary 2026 Guide, Middle market private equity associates can vary dramatically from $175,000 to $400,000 range based on fund size and performance, with meaningful carried interest exposure typically beginning at VP level. Investment banking compensation follows similar ranges with bonus components tied to deal completion and revenue generation.
Skill development requirements emphasize financial modeling, due diligence analysis, and operational assessment capabilities. Professionals must develop expertise in quality of earnings analysis, working capital management, and integration planning. Industry knowledge becomes increasingly important for deal sourcing and value creation planning. Communication skills for client interaction and presentation development represent critical competencies for career advancement. Networking in private equity can also be critical for breaking in.
Skill stack for middle market roles
- Modeling & QoE: LBO sensitivity, debt schedules, normalized EBITDA/working capital.
- Commercial: segmentation, pricing levers, NRR/churn, sales funnel diagnostics.
- Ops & integration: KPI scorecards, ERP/CRM basics, 90–180-day sprints, synergy tracking.
- Capital markets: unitranche vs TLB, covenants, lender materials, covenant calendar.
- Communication: IC memos, board updates, management alignment.
The MM skill stack is “operate with a spreadsheet”: numbers meet execution—exactly what interviewers probe.
Capital Access and Due Diligence
Access to capital presents a significant challenge for middle market companies, which often find themselves in a financing gap: too large to qualify for traditional small business loans, yet not sufficiently large to access public capital markets. This intermediate position necessitates specialized financial services tailored to their unique needs.
Middle market investment banks play a critical role in addressing this gap by providing bespoke financing solutions that acknowledge the distinct operational and financial characteristics of mid-sized enterprises. These institutions structure transactions that align with the complexities of middle market firms, facilitating capital access while managing risk effectively. Additionally, Business Development Companies (BDCs) serve as key financing partners, mandated to invest a substantial portion of their assets in middle market companies. BDCs offer a vital source of capital, supporting growth initiatives and providing investors with exposure to this segment.
Due diligence remains an essential component of investment in middle market firms. For investors, it functions as a comprehensive risk assessment process, enabling verification of financial and operational claims and identification of potential liabilities. For middle market companies, preparing a thorough due diligence package enhances credibility and increases the likelihood of securing investment. This process is particularly critical in the lower middle market, where financial controls may be less formalized and economic fluctuations can have pronounced effects.
Beyond risk mitigation, due diligence provides valuable insights into operational inefficiencies and opportunities for value creation. Addressing identified gaps can transition a company from a perceived high-risk investment to an attractive opportunity, thereby improving valuation and facilitating successful capital raises. For investors, rigorous due diligence serves as an effective safeguard against adverse outcomes, ensuring informed decision-making.
In summary, the interplay between capital access and due diligence is fundamental to the middle market ecosystem. Leveraging the expertise of middle market investment banks and BDCs, alongside comprehensive due diligence, enables these companies to secure necessary funding and position themselves for sustainable growth within competitive markets.
Growth and Expansion
Middle market companies constitute a substantial portion of the United States economy, accounting for approximately one-third of private sector revenue. Their contributions extend beyond financial metrics, encompassing significant job creation, innovation, and support for local and national economic development.
Growth opportunities for these firms increasingly involve expansion into international markets, offering avenues for revenue diversification and enhanced competitiveness. However, such expansion introduces complexities including the management of intricate supply chains, adherence to diverse regulatory frameworks, and the recruitment and retention of skilled talent. These factors necessitate sophisticated strategic planning and operational capabilities.
Digital transformation emerges as a critical enabler for middle market firms seeking to optimize operations, enhance decision-making processes, and improve customer engagement. The adoption of advanced technologies facilitates compliance management, supply chain efficiency, and overall operational agility, positioning these companies to better navigate dynamic market conditions.
Strategic partnerships with larger enterprises further augment growth prospects by providing access to additional capital, market channels, and expertise. Moreover, middle market companies often engage in direct investments and acquisitions, strengthening their position within their respective value chains and fostering competitive advantage.
Research and insights from the National Center for the Middle Market provide valuable guidance for investors and business leaders, highlighting the sector’s unique characteristics and growth potential. Informed investment strategies that recognize these attributes can capitalize on the opportunities inherent in middle market organizations.
Ultimately, the sustained growth and expansion of middle market firms are integral to economic resilience and prosperity. Supporting their development is essential for stakeholders involved in business development, investment, and economic policy formulation, as these companies serve as vital engines of economic momentum and innovation.
Glossary of Middle Market Terms
Platform acquisition: The initial investment by a private equity sponsor that establishes market position and operational foundation for subsequent add-on acquisitions and growth initiatives.
Add-on acquisition: Smaller, complementary company acquisitions that supplement the platform company to achieve scale, geographic expansion, or capability enhancement within the same investment period.
Roll-up strategy: Consolidation approach that combines multiple businesses in fragmented industries to achieve operational scale, cost reduction, and enhanced market position through systematic acquisition programs.
Sponsor: The private equity firm or financial buyer that leads the acquisition, provides equity capital, and manages the investment through board representation and operational involvement.
Enterprise Value/EBITDA: Primary valuation multiple calculated by dividing total company value (including debt and equity) by earnings before interest, taxes, depreciation, and amortization on a normalized basis.
Annual Recurring Revenue (ARR): Predictable, contracted revenue from subscription or recurring service models, commonly used for valuation and performance measurement in software and service businesses.
Management rollover: Existing management team’s continued equity participation in the post-transaction company structure, providing alignment and continuity through ownership stakes.
Unitranche: Single debt facility that combines senior and subordinated debt features with streamlined documentation and covenant structures, popular in middle market transactions.
Mezzanine financing: Hybrid debt and equity financing that provides current pay interest with equity participation through warrants or conversion features, typically used to reduce equity requirements.
Quality of Earnings (QoE): Independent accounting analysis that examines revenue recognition, expense classification, and earnings sustainability to verify financial statement accuracy and identify adjustment items.
Working capital peg: Closing adjustment mechanism that establishes normal working capital levels and adjusts purchase price based on actual working capital at transaction closing.
Earnout: Contingent consideration structure that provides additional purchase price based on future performance metrics, used to bridge valuation gaps between buyers and sellers.
Worked Example: Classifying Three Companies
Company A — Industrial Distributor
Revenue: $80M | EBITDA: $12M | EV (at 7×): $84M
Classification: Lower middle market. Likely buyers: LMM PE funds ($100M–$300M fund size), family offices, independent sponsors. Financing: senior + mezzanine, 4–5× leverage. Limited syndication — single lender relationship-driven.
Company B — B2B SaaS Platform
Revenue: $30M (ARR) | EBITDA: $6M (20% margin) | EV (at 15×): $90M
Classification: Core middle market on TEV, but LMM on EBITDA. SaaS multiples push it up. Likely buyers: growth equity, tech-focused MM PE. Financing: recurring revenue-based lending, potentially unitranche, 3–4× leverage on ARR.
Company C — Regional Services Platform
Revenue: $200M | EBITDA: $40M | EV (at 8×): $320M
Classification: Core middle market. Likely buyers: MM PE ($500M–$2B fund size). Financing: unitranche or senior/sub split, 5–6× leverage. This is a platform — expect add-on strategy at 5–6× to create multiple arbitrage against the 8× entry.
Key takeaway: Same ‘middle market’ label, three completely different deal dynamics — different buyer sets, different capital structures, different return profiles.
Frequently Asked Questions
There’s no single legal definition. In U.S. practice, a widely cited range is ~$10M–1B in annual revenue. Practitioners also segment by EBITDA and enterprise value (EV). Ranges vary by industry (e.g., software vs. industrials) and region (U.S. vs. EU frameworks). Treat them as directional, not absolute.
Use revenue to describe operational scale; use EV to describe deal size/capital required. In private equity shorthand, middle-market deals commonly fall around ~$25M–1B EV. Either lens can be correct; they answer different questions. Asset-light, high-margin sectors may look “smaller” on revenue yet transact at substantial EV.
LMM: ~$10M–$50M revenue; ~$2M–$10M EBITDA; lighter processes; family/independent-sponsor buyer mix.
Core MM: ~$50M–$500M revenue; ~$10M–$50M EBITDA; broader sponsor/strategic interest; deeper lender set.
UMM: ~$500M–$1B revenue; ~$50M–$100M+ EBITDA; formal auctions; syndicated or large unitranche debt. Ranges vary by sector/region.
They’re established but under-optimized: stable cash flows, fragmented markets, and room for operational engineering (pricing, procurement, salesforce, systems). Buy-and-build can add scale at lower add-on multiples. Entry pricing is often below large-cap levels, while deleveraging and quality improvements can lift equity returns.
Directional EV/EBITDA ranges (U.S. private deals, size-adjusted):
LMM: ~6.0×–8.0×; Core MM: ~8.0×–12.0×; UMM: ~9.0×–13.0×+.
Multiples vary with sector, quality, growth, and credit conditions. Recurring-revenue software may trade on ARR/revenue (or at higher EBITDA multiples) versus industrials or distribution.
More hands-on operations and integration in MM; auction formality and banker coverage rise with size. Large-cap deals emphasize scale synergies and syndicated financing, with tighter competition and higher entry multiples. Hold periods are similar (roughly 5–7 years), but the value-creation mix differs.
EU SME rules cap “medium” at <250 employees. The EIB “mid-cap” category spans 250–3,000 employees, which is closer in scale to the U.S. “middle market.” The U.S. typically uses revenue/EBITDA/EV lenses; the EU leans on headcount thresholds. Always label geography and framework when citing figures.
Sources / Evidence
Core definitions & counts
- NCMM – Middle Market Indicator (Year-End 2024; Mid-Year 2025): company counts, GDP and employment shares, recent growth rates.
- PitchBook – What is middle market private equity?: U.S. PE middle-market buyouts EV ~$25M–$1B.
Valuation & deal activity
- GF Data (H1 2025 coverage via Middle Market Growth): directional EV/EBITDA ranges and scale premia.
- PitchBook Q1 2025 US PE Middle Market: share of deals < $1B EV (~77–80%); < $500M EV (~70%); capital flows/dry powder context.
Framework & distinctions
- Practitioner’s Guide (your doc): U.S. revenue/EBITDA ranges; “middle market ≠ mid-cap indices; ≠ SME.”
- EU framing: SME ≤250 heads; EIB “mid-caps” 250–3,000 heads (contextual comparison).
Sector/industry concentrations & sentiment
- J.P. Morgan / Next Street: top revenue sectors; 2025 sentiment gap vs performance.
- BEA/BLS — macro context and employment baselines (latest available).
Related Technical Guides
- How to Build an LBO Model — Step-by-step framework with middle-market assumptions and benchmarks
- Enterprise Value vs. Equity Value — The EV bridge that determines deal size classification
- Private Equity Value Creation Levers — Revenue growth, margin expansion, and deleveraging in MM deals
- Private Equity DPI — How middle-market return multiples compare across fund vintages
- 5 Common LBO Modeling Traps — Pitfalls in modeling MM deals with platform vs. bolt-on assumptions
- Distribution LBO Case Study — A $150M middle-market deal walkthrough from entry to exit
- Net Operating Working Capital — The cash-conversion metric that varies by industry and deal size
- Browse All Technical Guides — Full library of PE frameworks, models, and career resources
Update Log
- March 2026 — Fixed typos, removed draft placeholders, added TL;DR, worked example with three company classifications, cross-links, update log
- September 2025 — Original publication